Google Discover filters out stale content before ranking: the SDF paper against our data
For two years, Google Discover has been removing stale articles before it even ranks them, and user reports of stale content have dropped by 54.9% over the period. Two models do this filtering: the first spots the article that more recent news has made obsolete, the second estimates when an article has already received most of its traffic. Six Google researchers describe this system, SDF, in a paper presented at the CIKM 2026 conference, which we compared with our own Discover data. SDF was already running at the start of the year, so on its own it explains little of the drop in reach our logbook has recorded since July. It shows the shape of that drop: articles keep their best day and lose their end of life.
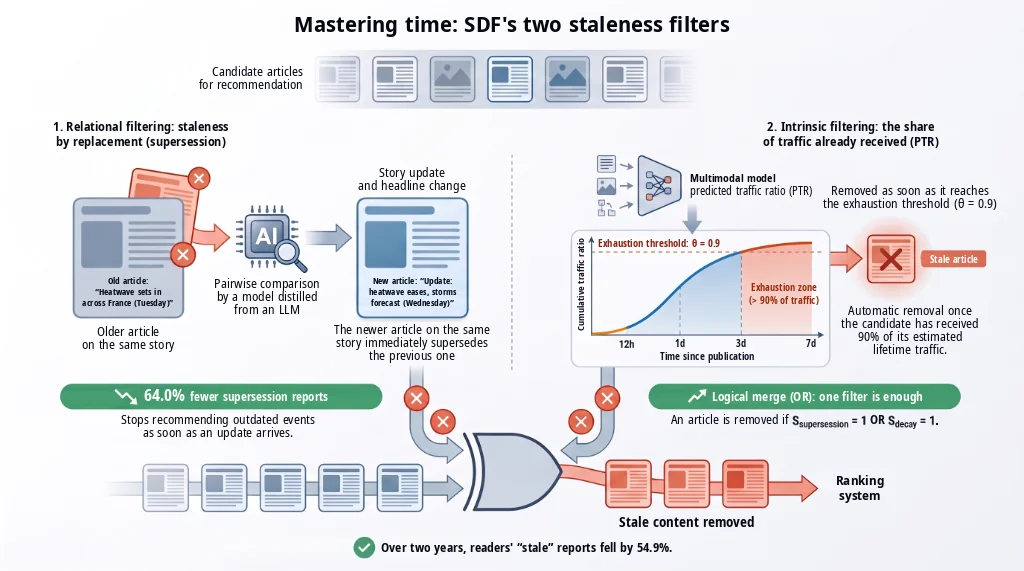
Mastering time, a visual summary of the paper. On the left, the supersession filter: a model compares Tuesday's article ("Heatwave sets in across France") with Wednesday's ("Update: heatwave eases, storms forecast") and removes the first. On the right, the decay filter: a multimodal model predicts the share of lifetime traffic already received and removes the article when it reaches 90%. The model works on seven horizons, from 12 hours to 14 days; the image shows four. The two decisions are joined by an OR: one filter is enough to discard the article, and only the remaining articles go on to ranking. The image uses the terms "relational" and "intrinsic" filtering: these are the article's supersession and decay, and its "exhaustion threshold" is the threshold θ. The heatwave example is ours; the paper gives others.
A "decisive match tonight" card three days after the match
A news feed announcing "Decisive match tonight" three days after the final whistle: the scene is common. According to the paper's authors, this kind of stale recommendation is one of the leading causes of complaints on large content platforms.
To avoid it, platforms usually rely on two simple safeguards. The first is a fixed age cutoff, such as "nothing older than 48 hours". It also removes evergreen guides, which stay useful much longer. The second is a click threshold: the article is removed when its clicks collapse. To observe that, the article must first have been shown, sometimes to thousands of readers. The paper calls these two recipes crude proxies:
"Traditional countermeasures serve as crude proxies: age cutoffs poorly reflect actual relevance loss, while engagement heuristics rely on lagging signals, broadly exposing users to stale content before the system adapts."
SDF, for Supersession-Decay Filtering, starts from another idea: an article goes stale in two ways. It can be replaced by more recent information (supersession1). It can also wear out on its own, because its topic had a short lifespan (decay). The first case requires comparing two articles. The second can be read from the article alone. SDF therefore gives each case to a separate model and removes an article as soon as either one judges it stale, before the ranking stage. According to the paper, this filtering also saves nearly 8.7% of the service's compute hours.
The SDF paper in detail
The paper is titled "Decomposing Staleness in Recommender Systems: A Dual-Filter Framework for Supersession and Decay". Its six authors work at Google: Di Bai, Feng Han, Zhenwei Tang, Jintao Liu, Luoshu Wang and Jialu Liu. Posted on arXiv on August 16, 2026, it will be presented at CIKM 2026, in Rome, from November 7 to 11. The field of application is explicit: SDF is described as "fully deployed in Google Discover", a feed that, according to the text, has hundreds of millions of daily active users and billions of monthly ones. The results cover two years of production. The publication date follows the conference calendar and does not signal any launch. The paper's most recent measurement dates from the first quarter of 2026; what may have changed since is unknown.
The authors illustrate the two mechanisms with examples from the news. For supersession, a bulletin reporting that "Queen Elizabeth II is under medical supervision", made obsolete within hours by the announcement of her death, or a report on Shohei Ohtani that "Ohtani is weighing offers from multiple teams", stale the moment his signing with the Dodgers was announced. For decay, a guide to "tonight's meteor shower", very useful for one evening and then hardly at all, or a heartwarming local clip that fades on its own, with no follow-up.
The first filter removes the article that a more recent article has replaced
This filter compares two articles. An article becomes stale when a more recent article, on the same topic, contradicts, outdates or replaces what it said. Its age alone is not enough. The paper defines the "same topic" as the same event or the same entity2. And only a more recent article can make another one obsolete.
Table 2 of the paper shows two of the model's decisions, with the rationale it writes. In the first, an article says the Oakland Athletics are looking to continue their winning streak against the Texas Rangers. The next article reports that the Rangers won the series. The model writes that the second "reports on the outcome of that series, making Article R outdated" (in the paper's notation, Article R is the earlier article and Article A the new one) and concludes: stale. In the second, an article covers the "fixed rate cliff" looming over the Australian housing market. A more recent article presents a general report from CoreLogic, a property data company, on how the market has evolved over three years. Both are about Australian housing, but only the first covers fixed rates. The model concludes: fresh. The specific article keeps information the more recent one lacks.
In production, the paper cites two other wins: "House GOP leaders float new plan", flagged stale by "House Republicans failed to agree on a spending plan", and "Mazda 3 IPM launching soon?", flagged stale by "Mazda 3 prices revealed".
Training this judge requires labeled pairs of articles, in very large numbers. The authors have them produced by a large language model, PaLM 2-L. They first labeled 300 pairs by hand, then adjusted the prompt until PaLM 2-L exceeded 90% precision and recall3 on those pairs. PaLM 2-L then generates seven independent answers per pair and keeps the majority, on the verdict and then on the rationale. The final corpus has 1,100,133 pairs. Choosing the pairs matters as much as labeling them: two articles that are too close are duplicates, two that are too far apart are about something else. The useful cases lie in between: articles close enough to cover the same topic, different enough to bring something new.
This large model needs too much compute to judge millions of articles a day. The authors therefore transfer its knowledge, by distillation4, to a smaller model: T5, in its 11-billion-parameter version. This small model first writes a short rationale, then its verdict, in the form "{rationale}. Therefore, {class}"5, the class being stale or fresh. The authors also train it on a related task, natural language inference6, which consists of judging the logical relation between two sentences.
| Variant of the small model | Precision | Recall | F1 |
|---|---|---|---|
| Verdict only | 83.68% | 85.15% | 84.41% |
| Verdict only, with NLI | 84.25% | 84.65% | 84.45% |
| Rationale then verdict | 81.31% | 88.14% | 84.59% |
| Rationale then verdict, with NLI (deployed version) | 84.31% | 85.28% | 84.79% |
Table 1 of the paper, on 110,155 test pairs. The differences are small; the deployed version gets the best F1.
On 550 pairs drawn from Discover and rated by humans, the deployed model reaches 83.5% precision and 95% recall. It therefore catches almost every case of supersession, while making errors in the other direction: about one pair in six that it judges stale is rated fresh by the raters.
In production, this filter runs in two ways. In online mode, it labels time-sensitive articles almost in real time, as they arrive. Later, a batch pass picks up articles with little exposure and those the first pass missed, then extends the "stale" label to the other articles grouped under the same topic.
The second filter removes the article that has already received most of its traffic
The second filter looks at an article on its own and estimates how much of its life is already behind it. The authors measure this life through traffic: a news article receives most of its visits shortly after publication, while an evergreen article receives them more evenly.
The model is called PTR, for predicted traffic ratio7. For a given time after publication, called a horizon, it predicts the share of total traffic the article will have received by then. Total traffic is counted over 30 days, a period that, according to the authors, covers the life of most Discover content. There are seven horizons: 12 hours, 1, 3, 5, 7, 10 and 14 days. They follow familiar rhythms: a few hours for breaking news, one to three days for daily news, five to seven for weekly content and up to two weeks for topics that wear out slowly. The clock starts when Google indexes the article, in practice shortly after publication.
The model reads only the content: the text, images and video, given together to the same model at the input (early fusion8). An editorial team classified a set of articles by time sensitivity. On this set, the method correctly classifies 80% of cases, against 76% when text, images and video are processed separately and then combined.
The model learns from clicks coming from Google Search, rather than from page views. The authors explain that page views, which are more numerous, are "biased by publisher promotion", skewed by the promotion publishers give their own articles. A search click, by contrast, reflects the reader's active intent.
At any moment, the system looks at the prediction for the last horizon passed: an article published four days ago is judged on its 3-day prediction. If it reaches the threshold θ = 0.99, the article is removed: the model estimates that it has already received 90% of its lifetime traffic, and that serving it further would add little. The authors chose this threshold among 0.85, 0.9, 0.95 and 0.98, to keep precision high. Five people rated each test article. The filter's precision exceeds 88%, whether a majority of three raters out of five is enough or all five must agree. Its F1 rises from 78.07% in the first case to 87.50% in the second.
The paper gives three production cases. A Geminid meteor shower guide was removed after the night of the event. A guide to the Phuket food festival, which lasts several days, was kept for its whole useful period. A New York Times explainer on health coaching passed the filter every time.
An evergreen article that receives its visits evenly over thirty days has received, at 14 days, about 14/30 of its traffic, or 0.47. It stays far from 0.9 at every horizon, and the filter lets it through. A match preview that receives 95% of its search clicks within 24 hours crosses the threshold at the one-day horizon. These two profiles are our own examples, built from the paper's definitions.
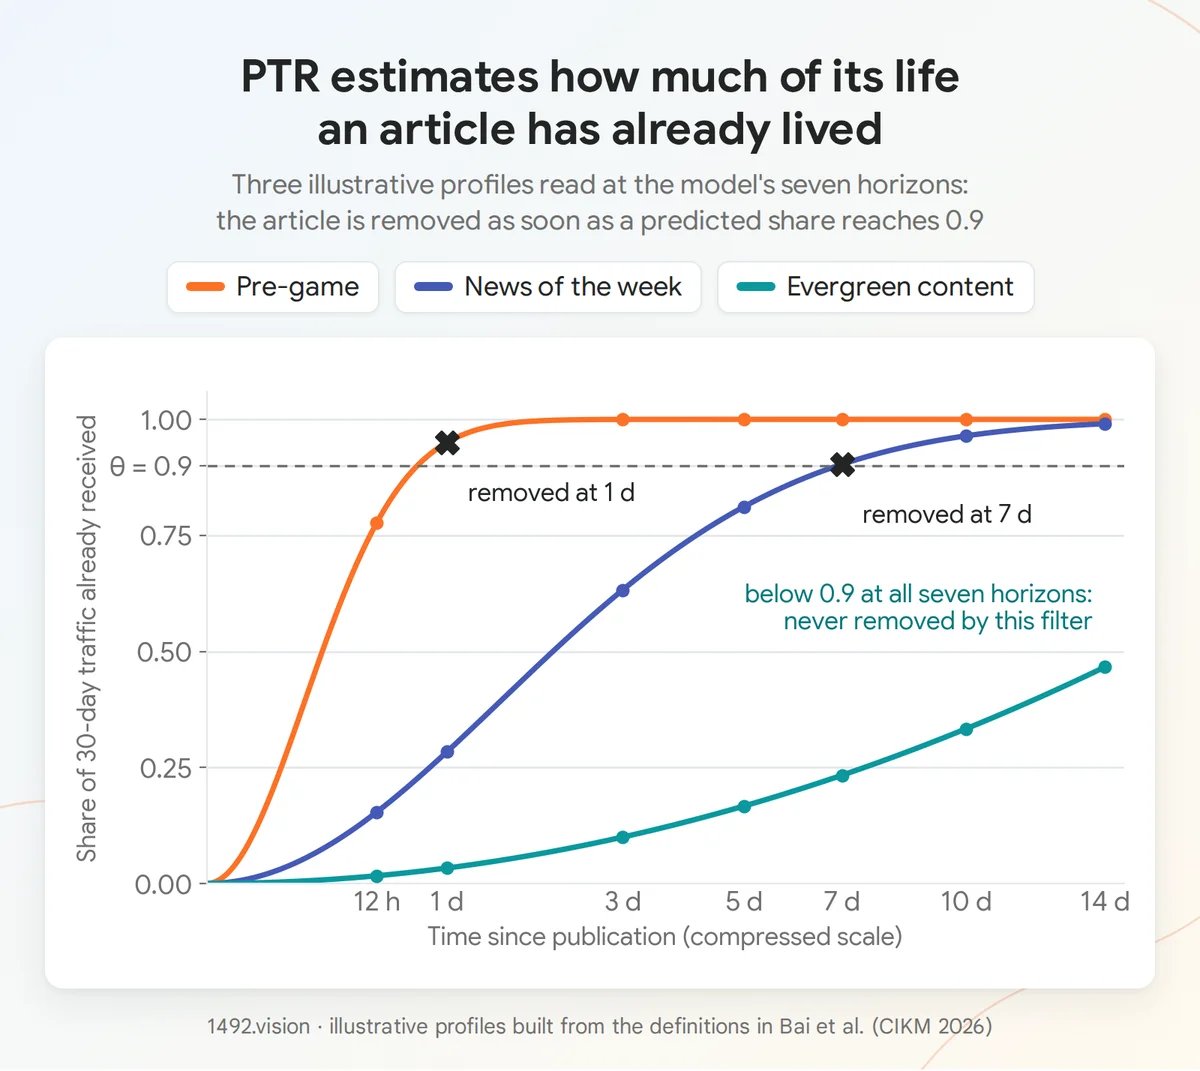
Three typical profiles of the share of lifetime traffic received, by article age, with the threshold θ = 0.9 and the model's seven horizons. A match preview crosses the threshold on the first day, weekly content around one week; evergreen content stays below the threshold up to 14 days.
The two filters are joined before ranking
The two decisions are joined by a logical OR. The paper writes it S = Ssupersession ∨ Sdecay: the article is removed if either filter flags it. Removed articles leave the candidate list, the pool from which ranking picks the articles to serve. The reader will not see them.
Both signals concern the article and are the same for every reader: only time makes them vary. Google computes them in advance and keeps them in memory. When a reader opens their feed, applying SDF amounts to looking up a table with the current time. The ranking that follows still relies on engagement and trends: SDF removes candidates; ranking decides the order of the feed.
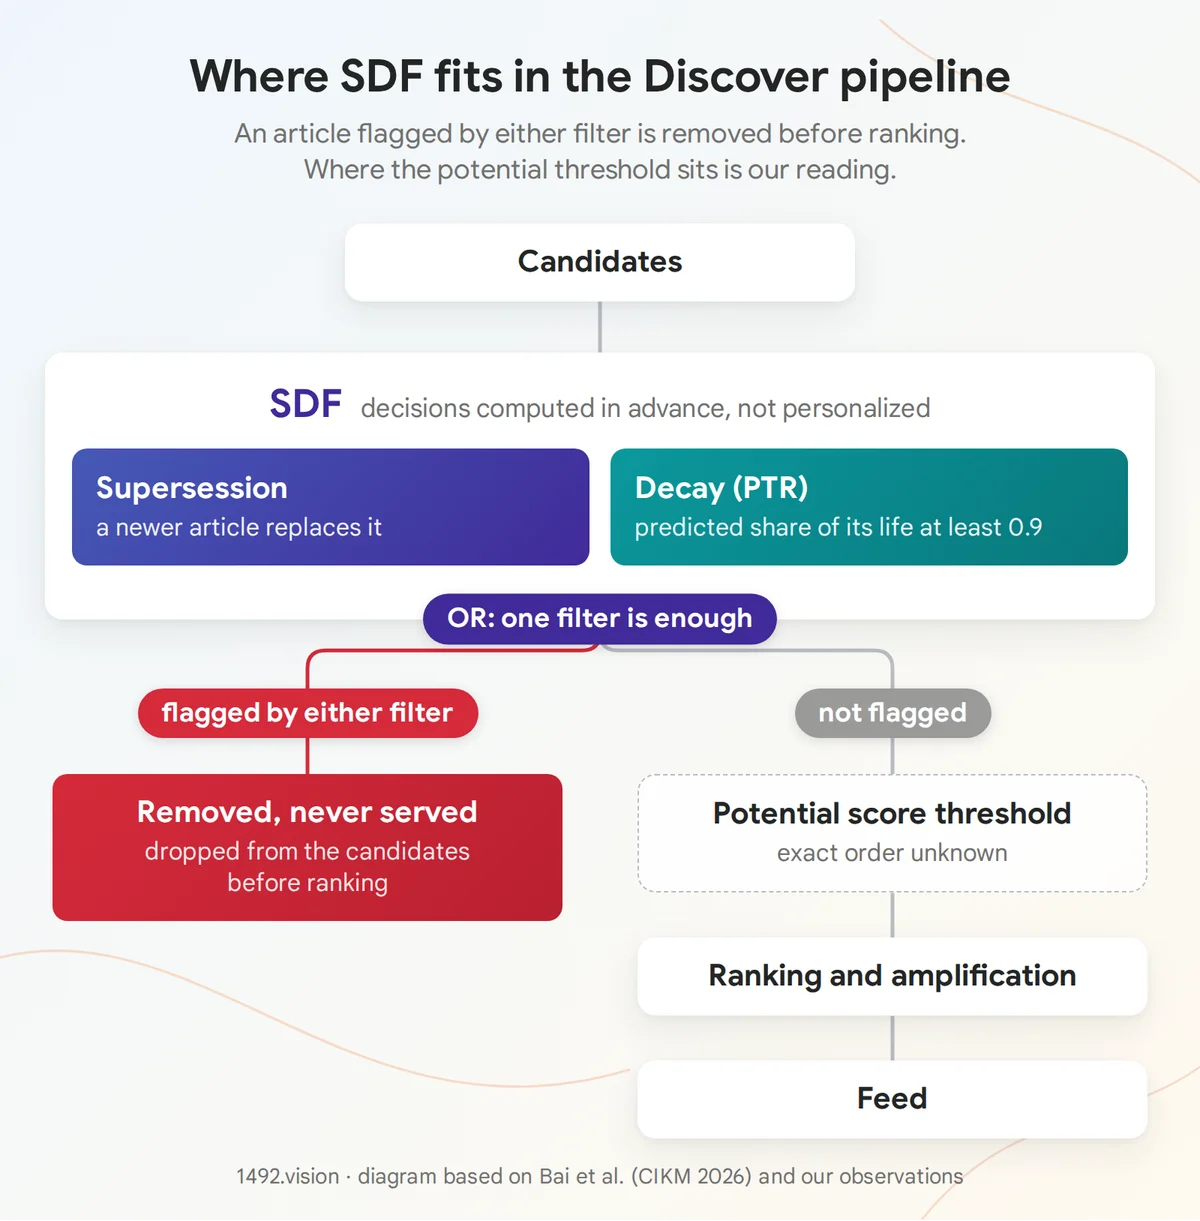
Position of SDF in the Discover chain. Candidates go through the two filters, joined by an OR; a removed article disappears from the feed. The others then pass the topic potential score threshold, a score we track and describe below, then ranking and amplification10. The exact order between SDF and this threshold is unknown. Diagram: 1492.vision, after Bai et al. (2026) and our observations.
SDF cuts reports of stale content by 54.9%
Online tests raised a measurement problem: user reports are too rare to separate two variants. The authors therefore had raters assess, every week for four weeks, two batches of articles: those the tested variant pushes up in the feed, and those it pushes down11. The metric is the gap between the share of stale articles in the first batch and in the second. The more negative it is, the better the variant pushes stale content out. All variants were tuned to keep engagement at least stable. The paper thus tests SDF, each of its two filters alone, and a baseline combining the two classic safeguards described above: an age cutoff and an engagement threshold.
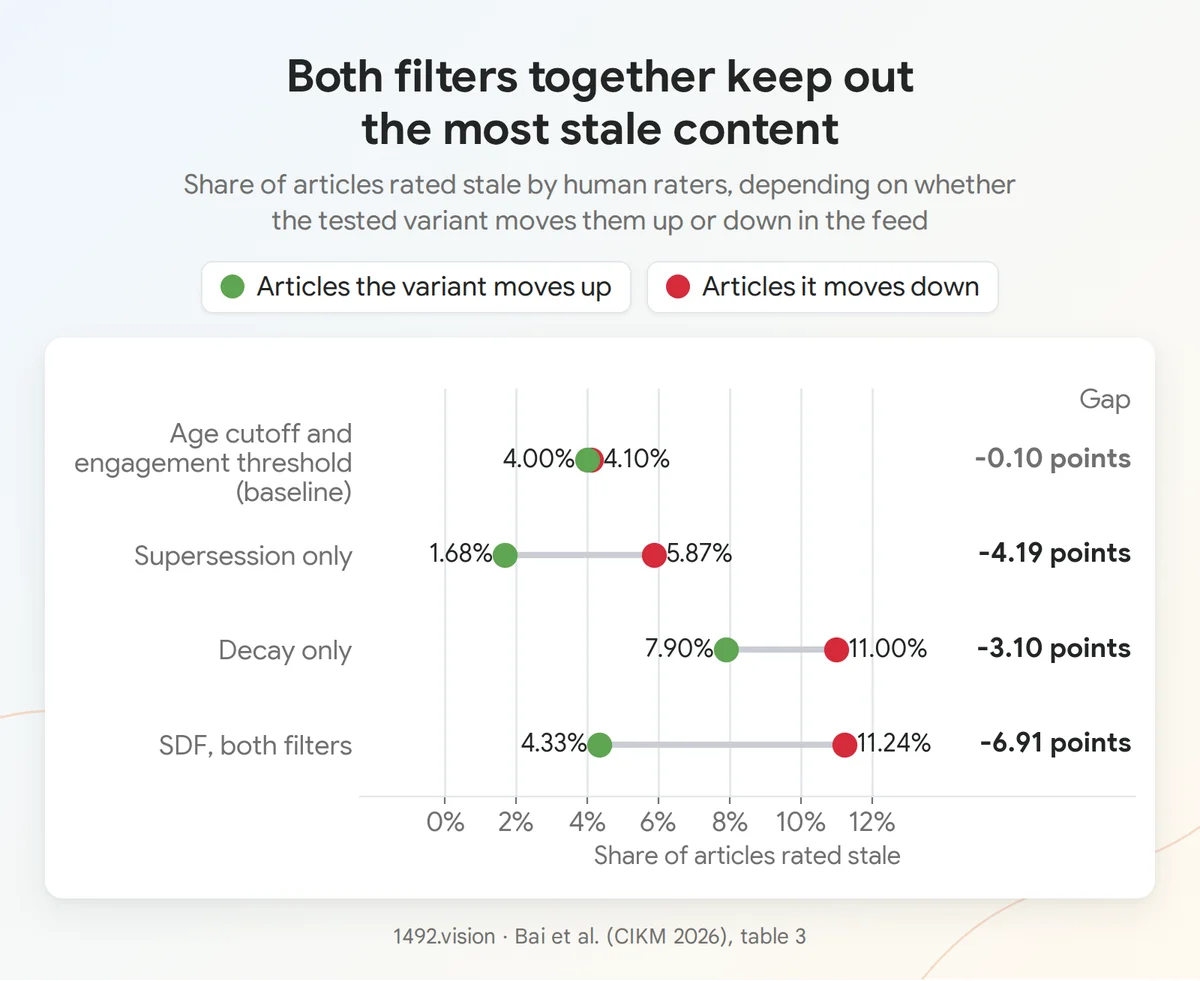
Table 3 of the paper, redrawn. For each variant, the share of articles rated stale among those it pushes up and among those it pushes down. Error margins omitted (0.81 to 2.56 points). The baseline's two points overlap: its effect is zero within the measurement's precision. Each SDF filter has an effect on its own, and the two together have the largest effect.
The articles SDF pushes down are stale in 11.24% of cases, those it pushes up in 4.33%, a gap of 6.91 points. Each filter already works alone, and the two combined have the largest effect. The authors conclude that the two filters target largely distinct forms of staleness.
With decay alone, the articles the variant pushes up are rated stale in 7.90% of cases, almost twice as often as those the baseline pushes up (4.00%), a gap the paper does not comment on. Each test moves its own articles, so these rates are hard to compare across variants. The slots freed by the decay filter may partly go to articles that only the other filter can spot, those overtaken by more recent news. With both filters, the share of stale articles among those pushed up is 4.33%.
A second test lasted two months: some users were deprived of both filters (a holdback group12). Against this group, SDF lowers the card dismissal rate by 0.16% and raises feed diversity by 0.13% and positive engagement by 0.26%. These effects are small but statistically significant, and they appear even though filtering reduces the number of candidates.
Over two years of production, the paper tracks the "stale" reports users file in Discover's quality menu, then classified as supersession or decay. Compared with the level before deployment, the total shows a 54.9% decline, with a drop of 64.0% for supersession and 34.4% for decay. The period covers, the authors note, successive model updates and an extension to other languages and countries, without detail or date.
Filtering also reduces compute. In the first quarter of 2026, the supersession filter saved 4.76% of the service's compute hours, on regular processors and on TPUs (the chips Google designs for machine learning, as opposed to general-purpose CPUs), and the decay filter 3.98% more, nearly 8.7% in total. Removed articles skip the heaviest scoring stages.
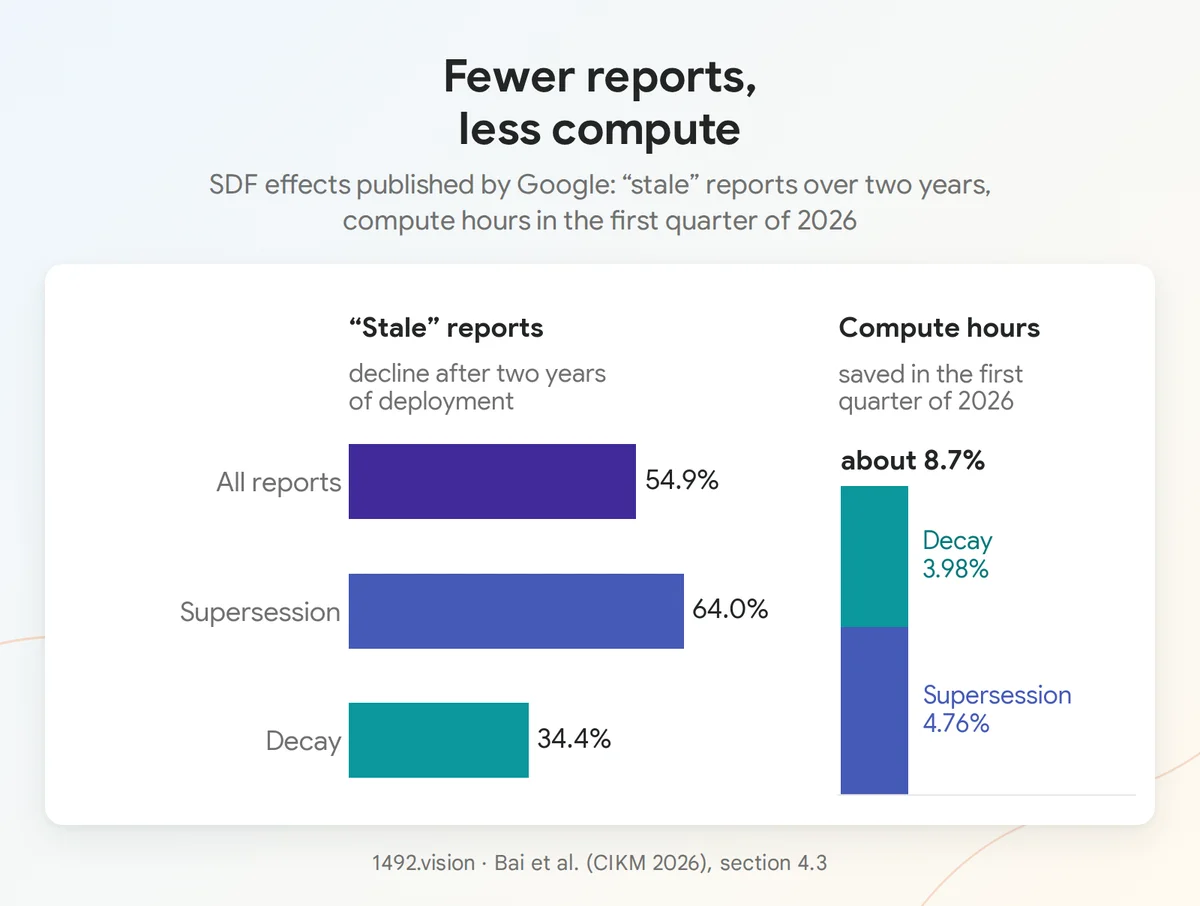
Left, the decline in "stale" reports filed by users over two years of deployment, relative to the level before SDF. Right, the compute hours saved in the first quarter of 2026. Data: Bai et al. (2026), section 4.3.
The authors acknowledge three failures
The authors list three failures. The supersession filter hesitates on some content, such as political commentary, which mixes opinion and fact and where no article clearly replaces another. PTR lets through many articles that wear out slowly: their predicted share stays below the threshold, and some stay in the feed when they are already somewhat stale. Finally, a large share of the remaining reports concern content the reader has already seen, on Discover or elsewhere, which falls outside SDF's scope.
The paper also announces what comes next. The supersession model is regularly updated with more recent language models. PTR is to gain reasoning from a multimodal language model, and to estimate lifespan continuously, instead of on seven fixed horizons.
The two filters in a Discover feed
Examples transposed to a French feed
The paper's examples are American. In a French feed, the two mechanisms would apply as follows. These cases are our own illustrations.
For supersession:
- "A midfielder close to signing for Marseille" becomes stale when "The midfielder has signed for Marseille" is published.
- "PSG-OM: what time and on which channel" becomes stale when "PSG-OM: player ratings" is published.
- "The heatwave sets in", published on Tuesday, becomes stale with "The heatwave retreats, storms expected", published on Wednesday.
- "Tour de France stage 12: route and favorites" becomes stale with the report of the stage win.
The CoreLogic case has its equivalent: an analysis of a club's finances, published before a transfer, can stay fresh after the announcement if the article on the transfer covers something else.
For decay:
- "Perseids: where and when to watch them tonight" is of no further use after the peak, like the paper's Geminid guide.
- The program of the Fête de la musique is of no use after the evening of June 21.
- A guide to a fair or festival that lasts a week stays useful for its whole duration, like the Phuket one.
- A shortcrust pastry recipe stays below the threshold, like the New York Times explainer.
Our panel received Michigan-UConn final previews after the result
Our data contain a clear case of missed supersession. The final of the US college basketball championship, Michigan against UConn, was played on the evening of April 6, 2026, US time. The table lists, in display order, the cards of one of the English-language feeds of our panel (each feed is the Discover stream of one of our test accounts), feed A in the figure below.
| Display time (UTC) | Card title | Status |
|---|---|---|
| April 6, evening | "Your NCAA championship guide: Michigan vs. UConn predictions" | preview, current |
| April 6, evening | "Solo Ball injury update: UConn guard injured ahead of game" | preview, current |
| April 7, midday | "FULL Trophy Presentation Ceremony Michigan Wins the 2026…" | result |
| April 7, evening | "Michigan holds off UConn, wins second NCAA basketball title" | result |
| April 7, evening, 3 minutes after the result | "How to Watch UConn vs. Michigan Men's National Championship" | preview, stale |
| April 7, evening, 5 minutes after the result | "Can Michigan beat UConn without a 100% Yaxel Lendeborg?" | preview, stale |
A second feed, feed B, shows the same thing the same evening: "UConn star Solo Ball expected to play" arrives there more than eight hours after the trophy presentation card, and two minutes before "Michigan basketball wins its first national title since 1989 with 69-63".
This is the paper's Oakland-Rangers case. The result is known, and the preview no longer gives the reader anything new. Yet these cards were served more than fifteen hours after the end of the match, next to the result. The filter reduces the share of stale content without eliminating it: in the paper's test, 4.33% of the articles SDF pushes up are still rated stale. We do not know why these pairs escaped it. Perhaps the system filed the guide and the result under two different topics, or the model got the pair wrong.
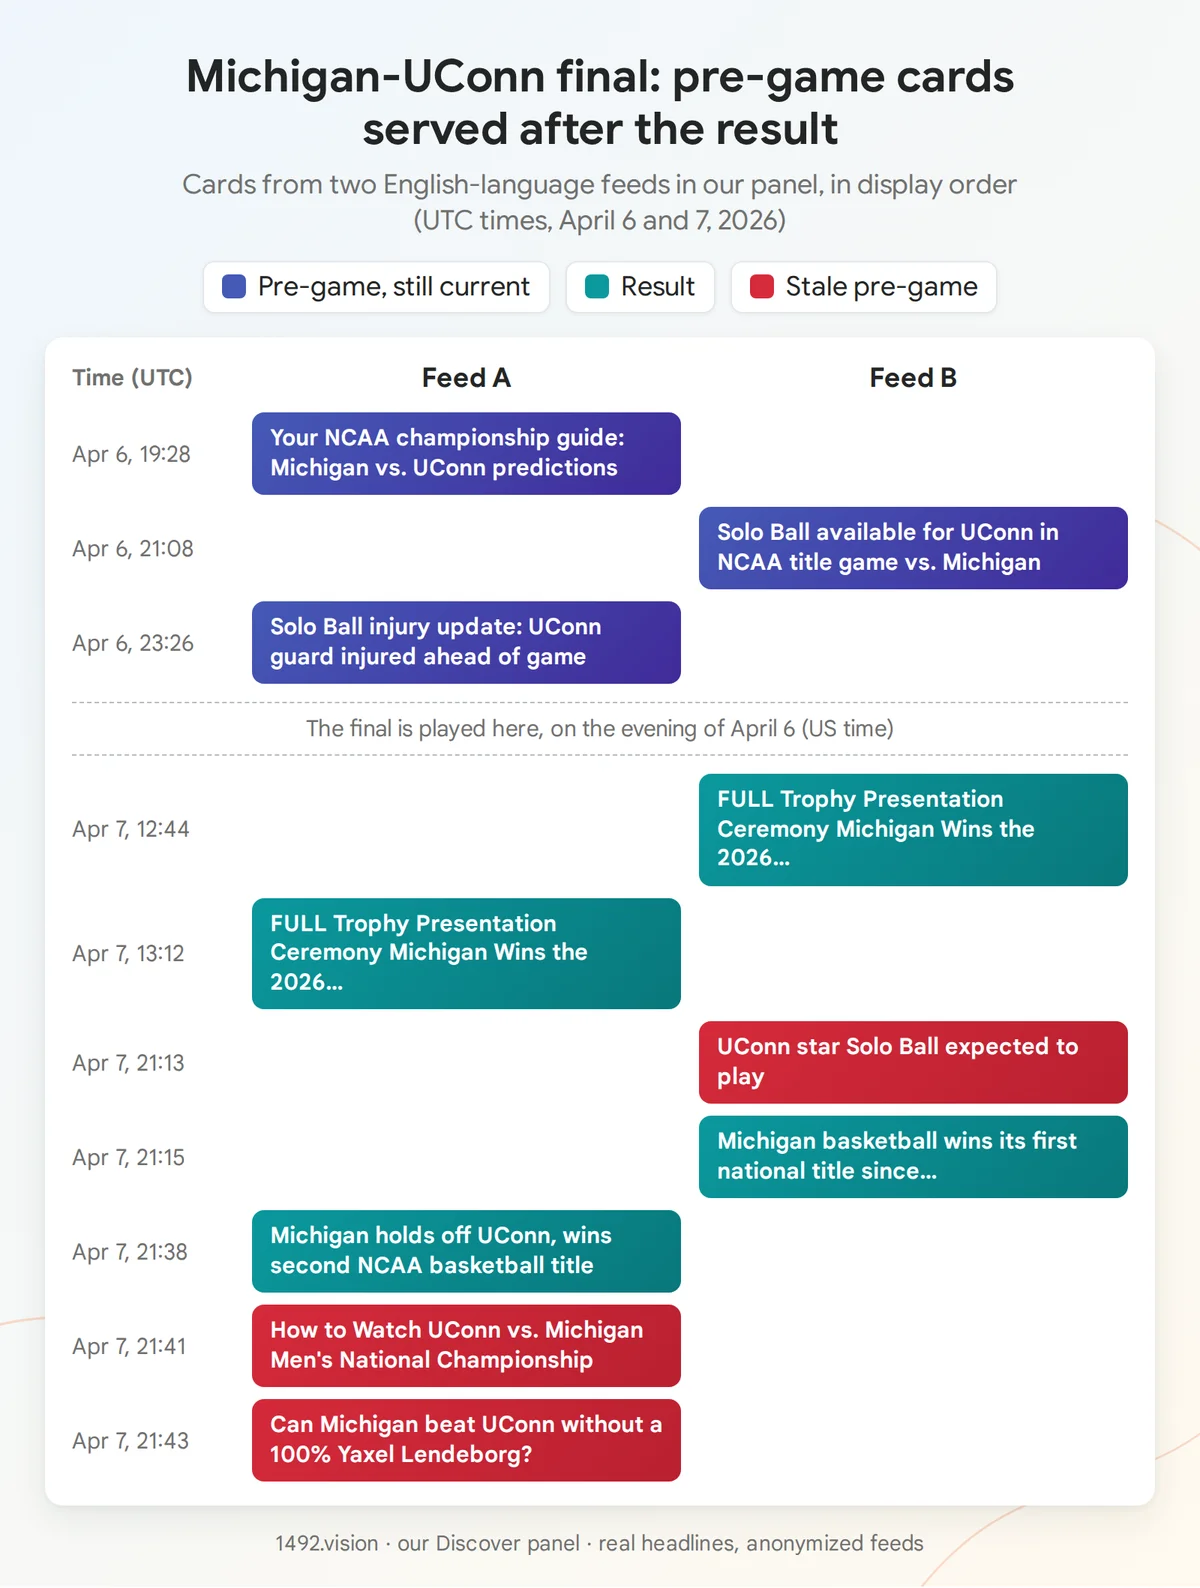
Two English-language feeds of our panel, labeled feed A and feed B, around the Michigan-UConn college final, April 6 and 7, 2026. On the evening of April 7, preview cards are still served minutes from the result cards, more than fifteen hours after the end of the match.
Event guides disappear from the feed the next day
Out of about 35,400 articles seen in our panel, videos and social posts excluded, 3.9% appear on at least two different days. For event-guide headlines ("what time", "which channel", "how to watch", "tonight", "live"), the share falls to 0.9%, out of 350 articles. These guides almost all disappear the next day, as the decay filter predicts.
In our data, recipes and gardening nonetheless come back less often than average (2.0% in both cases, against 3.9%). Our panel mainly follows news and tech profiles. On this point, the 1492 logbook's durations by category, measured on a much larger panel, are more reliable.
Our observations in Discover
The figures in this part come from our panel of Discover feeds, followed from March to October 2026. The 1492 logbook, which measures the whole market, is cited here only for comparison.
Displayed articles are rarely more than two days old
Some of the articles served carry their publication date in their URL, which gives their age at display time. Out of about 23,700 dated cards, 39% are displayed on the day of publication, 36% the next day and 15% the day after. Articles 3 days old or more make up a little over 10% of the total, those 7 days old or more 0.8%.
On the same set of five feeds followed from March to October, the share of articles 3 days old or more moves in steps:
| Month | March | April | May | June | July | August | September |
|---|---|---|---|---|---|---|---|
| Articles 3 days old or more | 9% | 8% | 15% | 13% | 12% | 8% | 8% |
Between May-June and August-September, the share of articles 3 days old or more falls in each of the five feeds. The share of articles 7 days old or more goes from 1.2% to 0.6%.
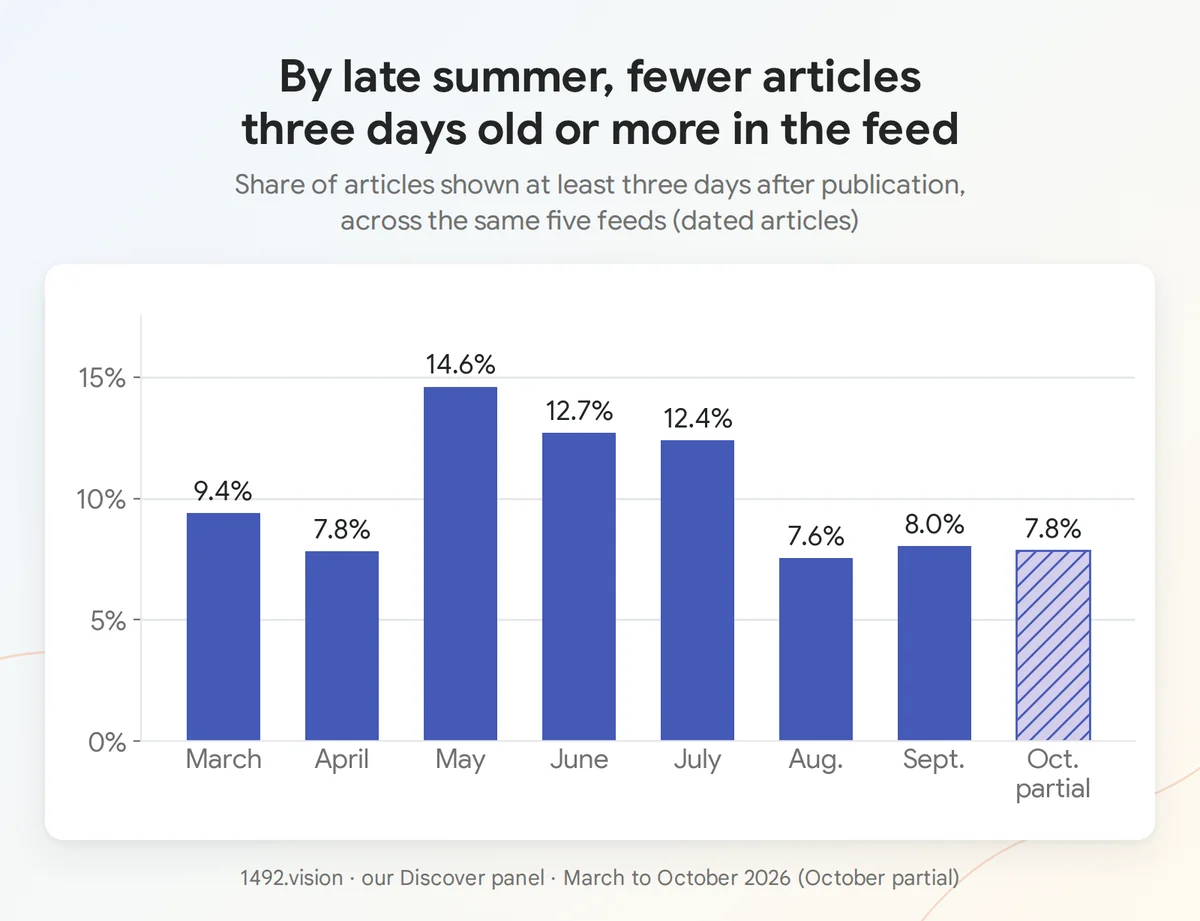
Share of articles displayed three days or more after publication, by month, on the same set of five feeds of our panel, followed from March to October 2026 (articles whose URL contains a date). October is partial.
The late-summer feed is younger than the May-June one, which is consistent with an earlier end of life. The decline only appears in August, however, and March-April were already at that level. A season busy with long-running topics, with the football World Cup from June 11 to July 19, could also explain part of the rise from May to July.
An article's audience drops after three days
Our audience measure, the number of displays of an article in our panel's feeds, follows the article day by day, without accumulation: it rises with its distribution and falls when it leaves the feed.
For 934 dated articles seen at least three times, we took, for each age, the median audience of the articles still seen that day, relative to their best day. On publication day, it is at 45% of the best day. It reaches its best day on D+1, the day after publication, stays above 80% until D+3, then drops: 56% at D+4, 50% at D+5 and 21% at D+6.
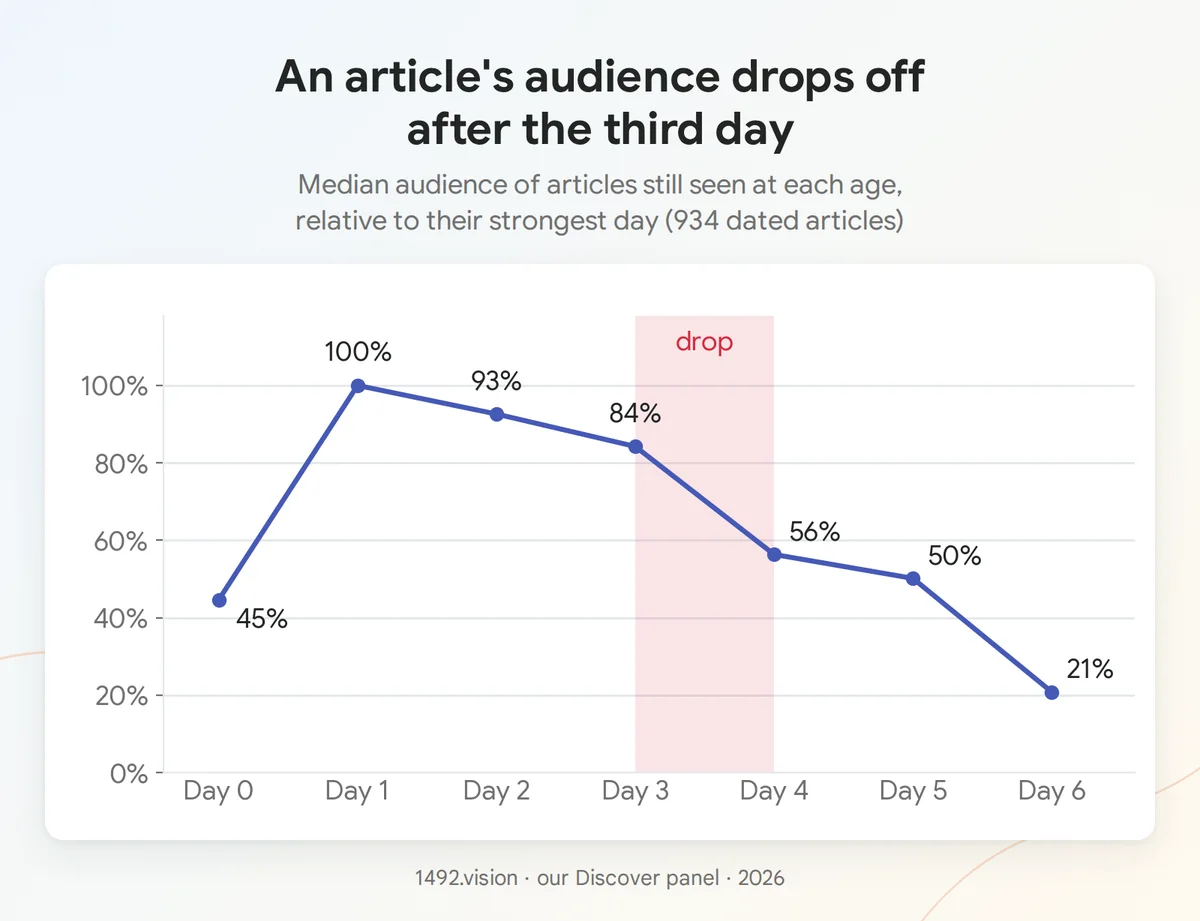
Median audience of the articles still seen at each age, relative to the best day (934 dated articles seen at least three times). The drop happens between D+3 and D+4.
An article that leaves the feed and comes back often restarts lower, like a new recommendation: this is the case for 46% of articles seen again after three days of absence, and 76% after five days or more, on only a few dozen cases. This second run reaches a median 58.5% of the first one's best day.
Among these returns, those of tech sites (eleven sites, including Frandroid, Numerama and Clubic) most often see their audience pick up again, by more than 5% above its restart level: 3 returns out of 27, or 11%, against 2 out of 36 for the major news sites and 1 out of 22 for video.
Three days is the limit the paper gives to daily news when it justifies its horizons ("daily reporting at 1 to 3 days"): past that point, a news article has in principle received most of its traffic.
The topic potential score compared with PTR
Among the scores we track, one comes close to PTR. We call it the topic potential score, as in our previous articles on prediction in Discover. It ranges from 0 to 1 and seems to estimate the volume of engagement an article can expect, across all readers. Between the fifth of articles with the lowest scores and the fifth with the highest, our audience measure is multiplied by 2.6. This link shows up on sets of articles: taken one by one, a low-scored article sometimes beats a higher-scored one.
The score depends more on the topic than on the publisher. On October 10, in the same feed, Le Figaro gets about 0.29 for an article on the oil agreement between Moscow and Washington, and 0.022 for a feature on a schooner moored in Bordeaux, thirteen times less. These October values are lower than in spring, since the late-June drop described below. A low score says nothing about quality: articles whose URL uses a clickbait formula get on average the same score as the others (0.187 against 0.183 on about 23,500 articles, in spring).
The score varies little from one reader to another: for the same article seen the same day, the median gap between feeds is 0.04, with a few clear exceptions. It also stays stable as the article ages. Over about 11,500 cases where the same feed sees the same article again a day later or more, the median score stays identical, and it varies by less than 0.005 in 82 to 90% of cases. PTR, by contrast, measures the article's aging by construction.
Like PTR, this score is computed on the content, it is barely personalized and it acts before ranking. But it estimates a volume of engagement, where PTR estimates a share of life already elapsed.
| PTR, decay filter | Topic potential score | |
|---|---|---|
| What it estimates | The share of the article's life already elapsed | The expected volume of engagement |
| Nature | A ratio from 0 to 1, which depends on age | A level specific to the article, stable with age |
| Personalization | None | Very low |
| Effect | Served or removed | Entry threshold, then weight in amplification |
| Source | SDF paper | Our observations |
This score works as an entry threshold. Before July, below about 0.10 to 0.12, an article had little chance of being amplified. In spring 2026, on a small number of articles, CuisineAZ had a potential of 0.094 and Marmiton 0.229. The first received negative amplification on 40% of its articles, the second never, even though CuisineAZ was ahead of Marmiton on the first of the two serving scores13. In our observations, this threshold comes first: an article that stays below this threshold is rarely amplified. The predicted engagement scores, specific to each reader (see our article on Discover card signals in 2026), then set the level of amplification, and following the source mainly affects how widely the article is distributed.
Peak audience falls by a third for the same publisher
The 1492 logbook measures the decline across the whole market. We checked whether it shows up in our panel publisher by publisher, to rule out a mere change in the feed's composition. For 135 domains present with at least 20 articles in May-June and in August-September, we compare the peak audience reached per article, as a median.
| Scope | Domains | Median ratio | Most exposed publishers | Least exposed publishers |
|---|---|---|---|---|
| All feeds | 135 | 0.68 | 0.50 | 0.87 |
| Articles seen on at least two days | 41 | 0.52 | 0.38 | 1.00 |
| English-language feeds | 81 | 0.68 | 0.52 | 0.84 |
| French-language feeds (at least 10 articles per period) | 41 | 1.18 | 0.41 | 1.50 |
Ratio of the median peak audience per article, August-September 2026 over May-June 2026, publisher by publisher. 1 means no change. The most exposed are the 25% of domains whose articles had the highest audience in May-June, the least exposed the 25% with the lowest. The counts do not add up: each scope applies its threshold to its own feeds' articles only, and a domain can appear in both languages.
The median ratio is 0.68: a typical article from these publishers reaches in August-September about two thirds of the audience it reached in May-June. The decline affects 76% of domains. It is stronger among the most exposed publishers (0.50) than among the least exposed (0.87), and stronger still on articles seen on at least two days (0.52), those that have an end of life to lose. Measured at the article's first appearance rather than at its peak, it remains of the same order (0.70). Our observation frequency therefore explains little of the decline.
French-language feeds give a more mixed result, on a smaller sample: the median ratio there exceeds 1 (1.18). The most exposed publishers fall sharply (0.41) and the least exposed gain (1.50). The 1492 logbook describes a shift of another kind: the national press loses a quarter of its share of voice while the regional press triples it. Here we rank publishers by exposure, the logbook by type: the two results are hard to compare.
On the same domains, the average potential score also falls by about 30% (ratio of 0.70), for almost all of them. Across the whole panel, week by week, the decline is a quarter (see below). The score has therefore fallen at each publisher: the content mix is not the cause.
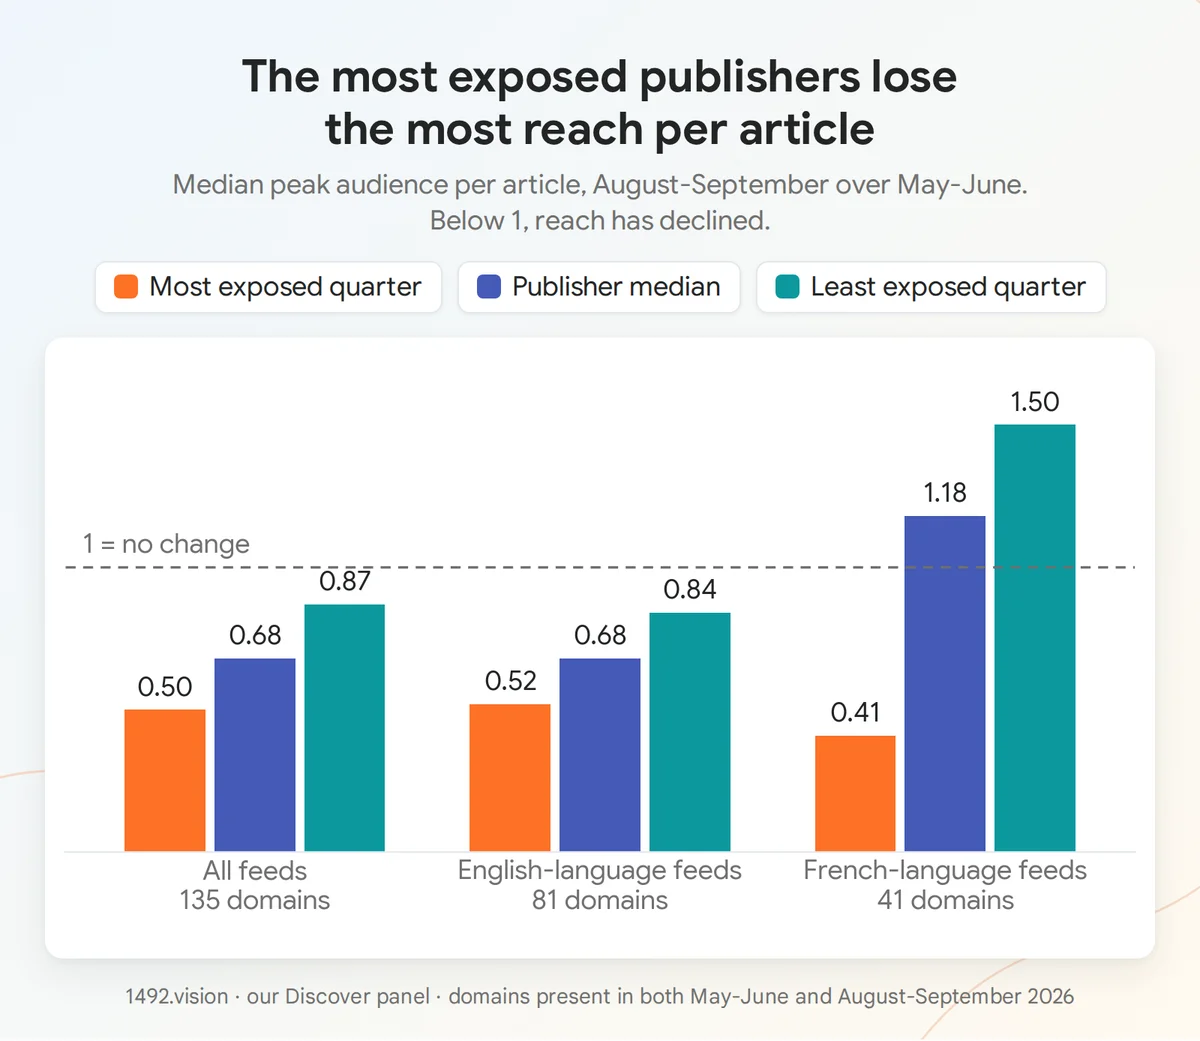
Ratio of the median peak audience per article, August-September over May-June 2026, by publisher exposure in May-June. 1 means no change. English- and French-language feeds are shown separately, and the counts of the three groups do not add up (see the table).
A model that predicts a volume of engagement, retrained on a feed where articles stay for less time, would automatically learn lower volumes. A mere recalibration of the score, unrelated to staleness, would however produce the same decline, and our data cannot separate the two hypotheses.
Several Discover scores change between June 30 and July 3, 2026
In our English-language feeds, several scores we track change shape in the same week. On June 30, two new prediction scores appear on most cards. Between July 1 and 3, another prediction score, until then capped at 1, can now exceed that value. On July 1, a topic classification of articles appears on almost every card. From June 30 to July 3, the two serving scores that accompanied the potential score give way to two new ones. One of those that disappeared is the one we called the serving confidence score, which remained a puzzle to us.
The potential score follows the movement. As an index (100 = average from April 1 to June 14), it stays between 82 and 116 until the week of June 22, around 99 on average. From the week of June 29, it stays between 63 and 83, around 75, until October. In spring, only the week of June 15 had dipped into that range.
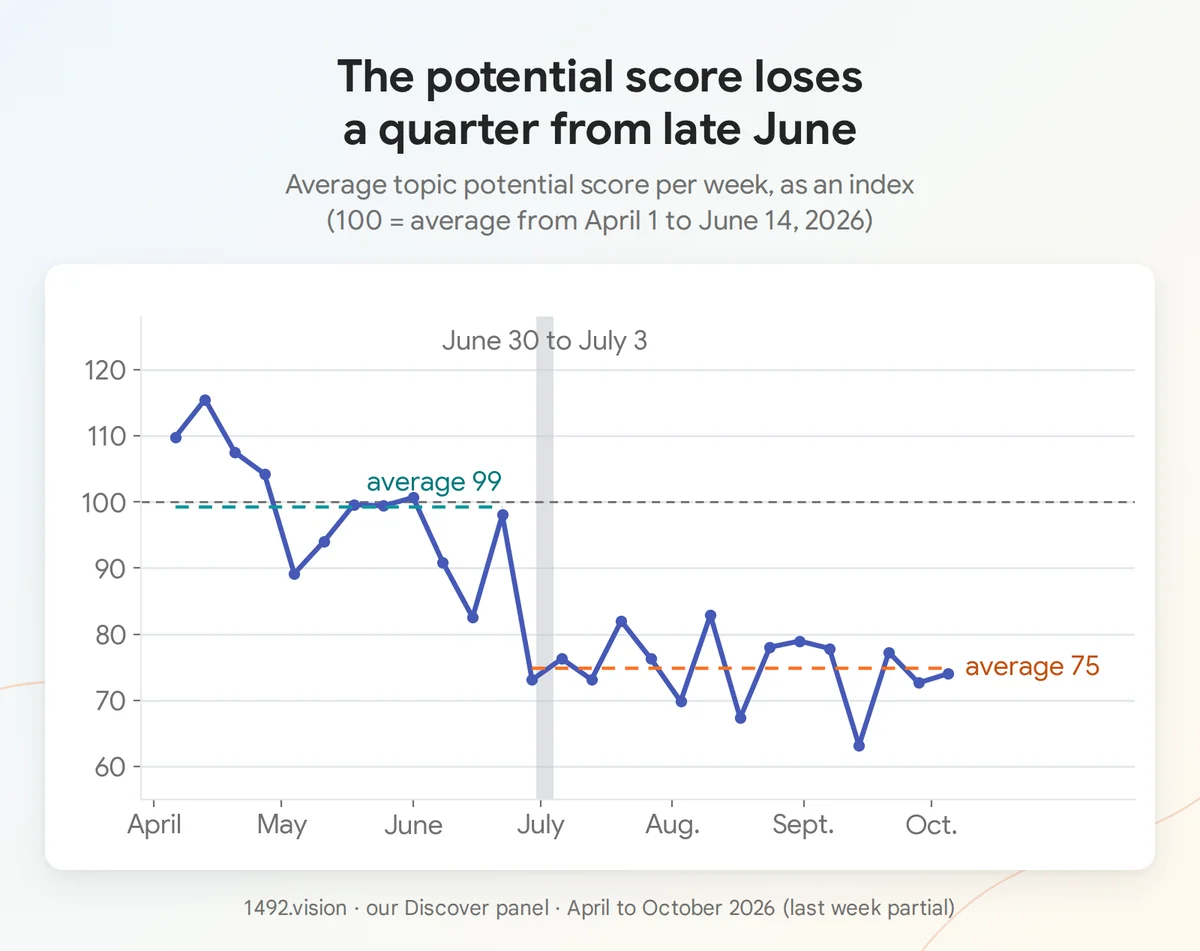
Average topic potential score per week, as an index (100 = average from April 1 to June 14, 2026). The grey band marks the week of June 30 to July 3, when several scores change shape.
This week coincides with the start of the decline recorded by the 1492 logbook, which places the break in July. Nothing, however, allows us to attribute it to SDF: the changes we see affect prediction and potential scores, and therefore ranking and entry into the feed. And the paper mentions successive updates over two years, without dating them.
Amplification stays stable as the article ages
Two of our tests looked for an effect of time on an article's distribution. An article's amplification stays stable from one day to the next: over 207 pairs of observations of the same article in the same feed, one or two days apart, it stayed identical. We also looked for wear within a single session, where an article would lose strength with each redisplay: our checks ruled it out.
In Discover, time therefore seems to act like a gate (the article is served or not) and not like a slope that would demote it little by little. SDF makes the same choice. Its authors criticize age-based ranking for merely demoting stale articles, which the reader still has to scroll past.
Freshness has its own channels. Our study of Discover's pipelines describes some that seem dedicated to recent content, starting with freshvideos for video; SDF acts at the other end, on stale content.
Perspectives
The same team also describes Discover's ranking
Four of SDF's six authors, Di Bai, Zhenwei Tang, Jintao Liu and Luoshu Wang, are also authors of a paper presented at the RecSys 2026 conference on Discover's ranking (arXiv 2607.27577). It describes the ranking model in production: a single neural network that predicts 11 behaviors at once, positive (clicks, likes) or negative (dismissals, blocks). It also tests on 1% of Discover traffic a variant, HA-MoE, which splits the work among several specialized sub-models, presented as ready for production. SDF acts just before this ranking model. Read together, the two papers describe the chain: candidates, a staleness filter, then multi-objective ranking.
We currently isolate about nine prediction scores per card, including the two that appeared on June 30. 1492 has been describing this family of scores publicly since December 2025. The paper's two families both appear: some rise with engagement, such as the deep engagement score, others estimate disinterest, such as the "scroll-past" score, the risk that the reader scrolls past the card without stopping. The paper keeps the list of its 11 predictions to itself: it is impossible for now to match each of our scores to one of them. We also do not know whether HA-MoE has been deployed since its test. We will devote a future article to this paper and to our scores.
Discover groups articles on the same topic
Discover sometimes attaches the same topic identifier to articles from several publishers, probably to limit the room one story takes in the feed. In our data from March to May 2026, the groups formed this way bring together 2 to 7 domains and usually last 1 to 4 days. Among those with at least three articles, 86% share the same entity. On April 10, in one of our feeds, three articles on Anthropic, from Presse-citron, Developpez.com and Clubic, carry the same identifier. They appear about an hour apart.
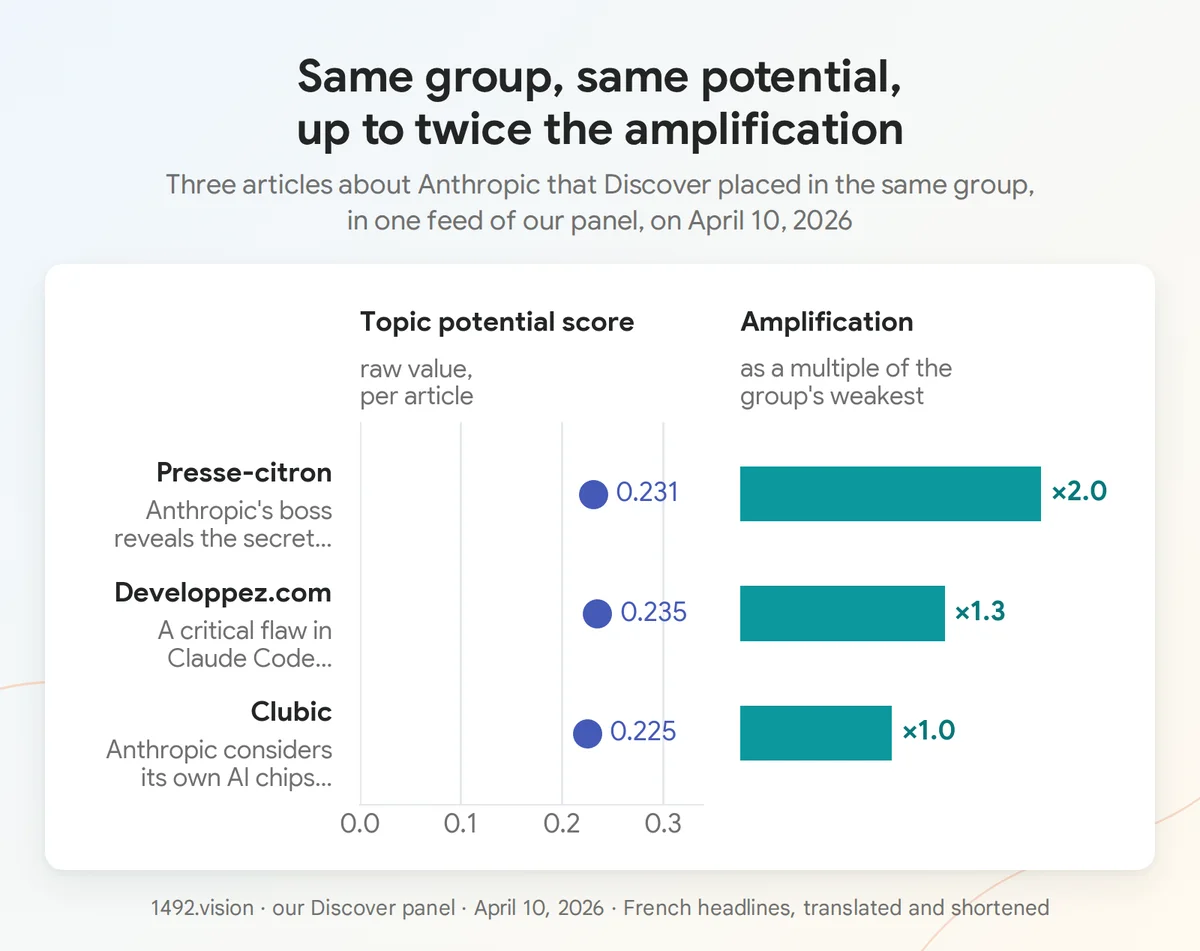
A group up close, in one feed of our panel, on April 10, 2026. The three articles appear about an hour apart. Their potential score is nearly identical, from 0.225 to 0.235, and the highest amplification score is twice the lowest. Amplification is expressed as a multiple of the lowest of the three, which only makes sense because all three are positive here. Headlines shortened.
On average, the most-served and least-served articles in a group have almost the same potential score and the same predicted engagement. Yet the most-served reaches an audience about 6 times higher, and more than 100 times higher in 33 groups out of 455. Its amplification is on average only 14% higher, and it explains part of the gap: the least-served is also the least amplified in 55% of groups, against 45% expected by chance. That chance is one in two in groups of two articles, which make up three quarters of the total, and lower in larger groups. Amplification follows potential more closely: the article with the lowest potential is also the least amplified in 66% of groups, against the same 45% expected by chance.
On the same topic, an article must therefore first survive more recent articles (supersession), then win its group in ranking. We checked whether the winner is more often the most recent, which would be the sign of supersession. It is in 44% of groups, against 46% expected by chance. The test is fragile, because our measure favors articles that have been present longer.
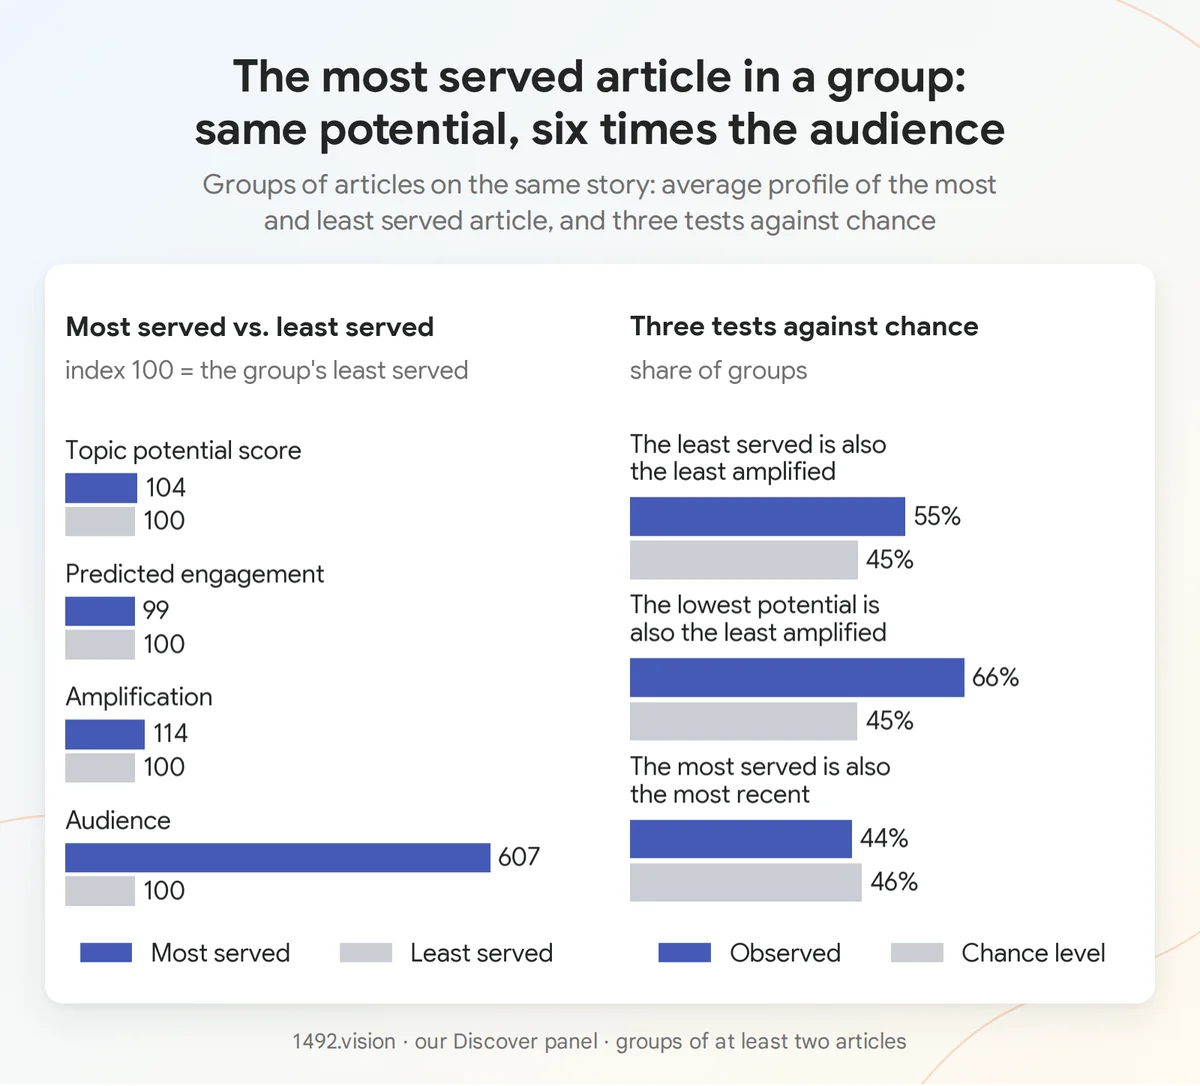
Left, the most-served against the least-served article in the same group, as an index (100 = the least-served). Right, three tests against chance, as a share of groups. Chance is one in two in a group of two articles and lower in larger groups, 45% on average. The profile and the first two tests cover 455 groups of at least two articles, from March to May 2026, the recency test the 221 groups where it is possible.
The reader has their own clock
SDF is the article's clock. The reader has their own. In our data, the weight of an interest in a reader's feed, a value computed by Google that we read from the feed data, decreases with the time spent without seeing it: by about 2% after 1 to 3 days, 4 to 5% after 4 to 7 days and 14% after 8 days or more, this last band resting on a small sample. The decline follows the duration; the number of times the reader opened their feed without finding this topic has no effect. This logic recalls a Google patent on weighting recent interests (US8972391, "Recent Interest Based Relevance Scoring").
Google has published on content age since 2008
Content age is an old question at Google. In 2008, patent US7346839 ("Information retrieval based on historical data", whose inventors include Matt Cutts and Jeff Dean) reads it from documents' update dates and the age of their links. It notes that stale documents ranked too high "degrade the search results". In 2016, YouTube's paper on its recommendation networks (Covington et al., RecSys 2016) tackles the problem from the other end: a model trained on the past underestimates new content. It feeds the examples' age to the model during training, then sets it to zero at serving time, because users prefer fresh content, "though not at the expense of relevance". In 2023, YouTube describes a multi-funnel system for fresh content, based on age and interaction thresholds. The SDF paper cites it as an example of the practices it aims to move beyond. SDF, in 2026, predicts staleness from the content, with a language model and a multimodal model, and applies it as a filter.
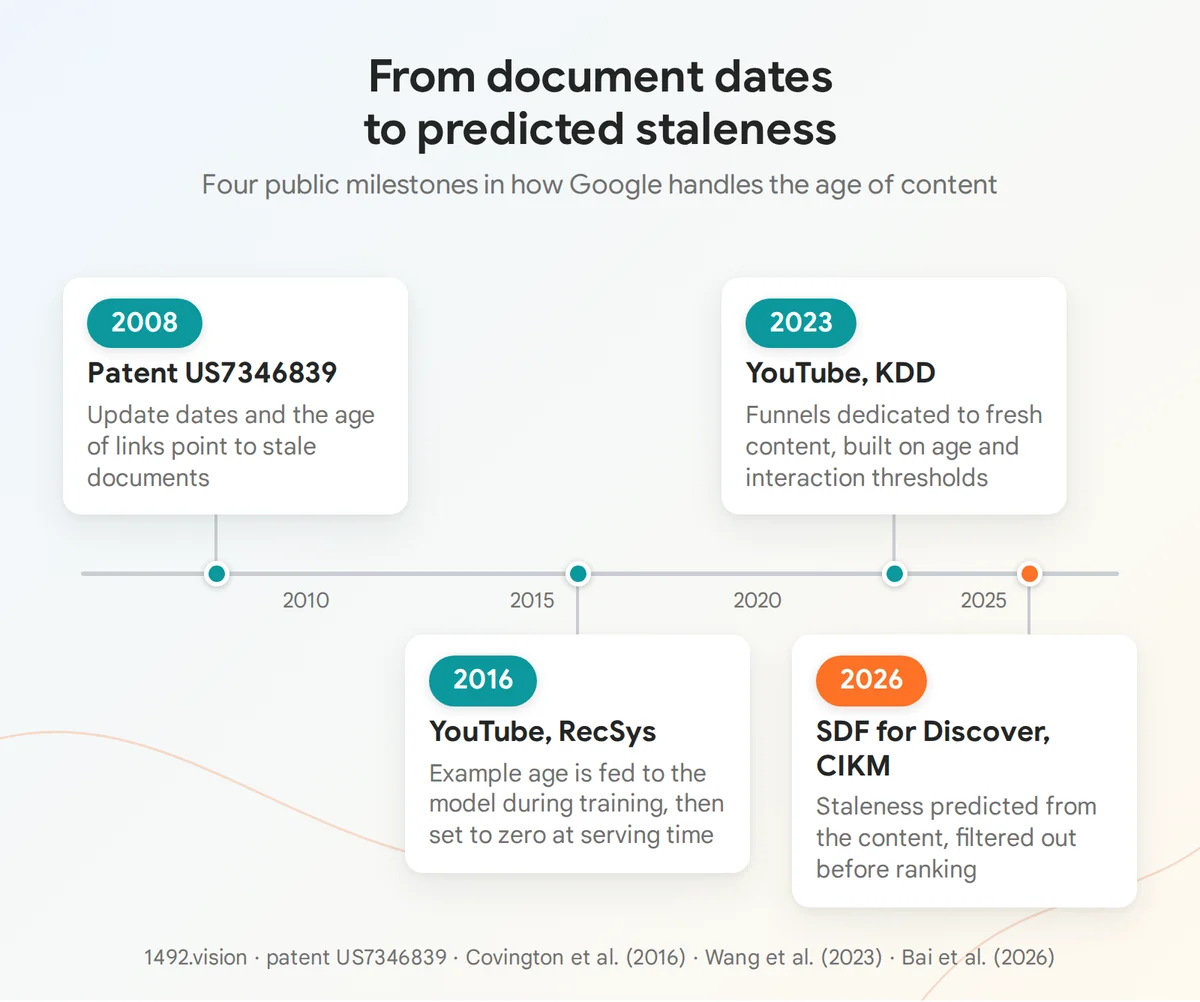
Four public milestones on content age at Google: a search patent (2008), two YouTube papers (2016 and 2023) and SDF for Discover (2026).
SDF and the reach decline recorded by 1492
The 1492 logbook of October 8, 2026 starts from one finding: since July, top articles have lost a third of their reach. Its main figures:
- In September, the reach of the 1,000 most exposed articles in each language is at index 68 in France, 66 in Italy, 60 in the United States and 58 in Spain (100 = January-February 2026).
- An article's best day declines little (index 88 in France). The decline comes from the following days: between the February and September cohorts, the share of reach obtained after the best day goes from 25% to 17%, and exposure duration from 3.6 to 2.7 days.
- Evergreen content loses the most: gardening goes from 5.4 to 3.3 days of exposure, recipes from 5.3 to 3.4, against 3.3 to 2.6 for news and 2.6 to 2.2 for sport.
- The feed is slightly less concentrated: in France, the ten most exposed articles of the day go from 0.7% to 0.6% of exposure.
- The national press loses a quarter of its share of voice; the regional press triples it. The regional press's gains come from the general feed: the share of its exposure coming from local pipelines (the channels that recommend local news) goes in median from 12.7% to 1.6%.
- Republishing the same headline under a new URL keeps the topic visible about 50% longer, a practice 1492 advises against.
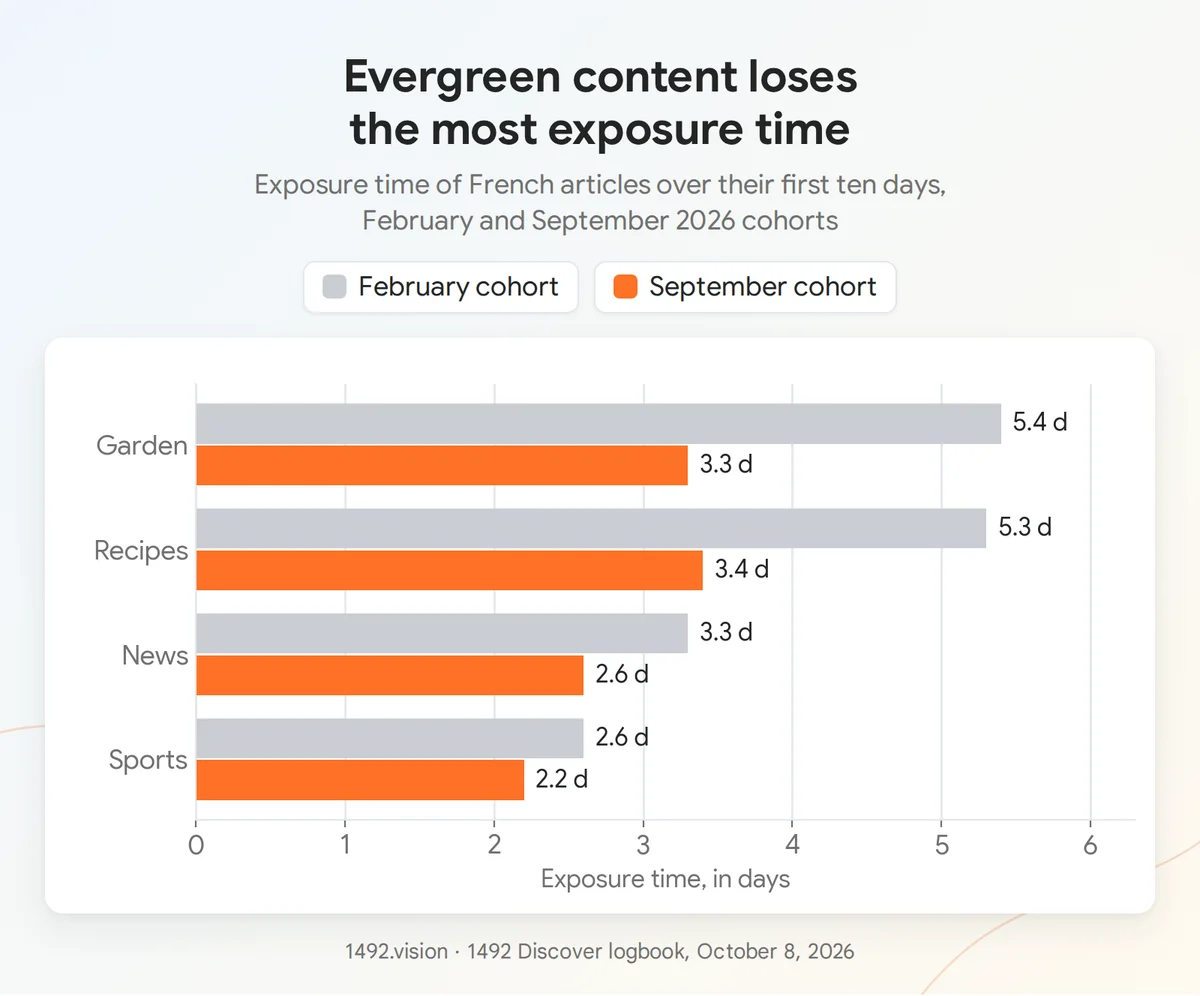
Exposure duration of French articles over their first ten days, February and September 2026 cohorts, by content type. Source: 1492 logbook of October 8, 2026.
SDF was already running during the logbook's reference period: the paper measures its compute savings over the first quarter of 2026, with both filters in service. The SDF it describes is therefore part of the starting point (January-February 2026). For it to play a role in the decline, it would have to have changed after March.
The paper leaves this possibility open without dating it. It mentions successive model updates and an extension to other languages and countries, and the authors say they are working to enrich PTR. They also acknowledge that PTR misses "a long tail of gradually-decaying items", many articles that wear out slowly. If an update deployed this summer removed these articles, it would cut their end of life and leave their best day intact. That would be the profile the logbook describes: a nearly stable best day, and evergreen content losing the most. An extension of SDF to new languages would explain little of a simultaneous decline in four markets, the United States included.
With this caveat, we compared each finding with the mechanism the paper describes.
| Finding of the 1492 logbook | Possible explanation by SDF | Confidence |
|---|---|---|
| Simultaneous decline in four markets from July | A filter that is identical for all readers and deployed in several languages changes everywhere at once when its model or threshold changes | Medium for a global change, low for SDF specifically |
| Nearly stable best day, shortened tail | PTR's rule cuts the end of life and leaves the best day intact, and the authors acknowledge that it lets through articles that wear out slowly | Medium |
| Evergreen content hit hardest, all categories pulled toward 2 to 3 days | As described, PTR spares evergreen content. It would take a modified model or threshold, for example with the announced continuous lifespan | Low |
| Republishing under a new URL extends the topic by about 50% | PTR's clock starts at indexing: a new URL starts from zero, even if each one disappears just as fast | Medium |
| Slightly less concentrated feed | Removing end-of-life articles frees up slots, and the paper's holdback test shows diversity up 0.13% | Low |
| Regional press up, local pipelines down | SDF judges the article alone, whatever the publisher and the place | Outside SDF's scope |
In our audits, at a large national daily, the share of its news output admitted to Discover, that is, seen in our panel's feeds, went from 82% to 71% in September, while the amplification of admitted articles remained positive in about 95% of cases. The decline therefore happens at entry, which is consistent with an upstream filter, SDF or the potential threshold, without our being able to say which.
The changes we date to June 30 to July 3 mainly affect ranking and potential scores. July probably combines several changes. SDF helps to read the shape of the shortening of articles' lives.
Takeaways for publishers
The paper gives no advice to publishers. The takeaways below are our deductions, based on the mechanism it describes.
- Publish the update yourself. On a developing story, the article that gives the outcome replaces the others. A headline that states the result helps the model judge, as in the Rangers case ("Article A reports on the outcome of that series").
- Keep a specific angle. The CoreLogic case shows that a specific angle survives a more recent, broader article, as long as the latter omits your information.
- Keep "tonight" and "this evening" for news content. PTR reads the text, images and video to estimate a lifespan. A dated phrase, or a photo of a finished event, can place the article among short-lived content.
- Put in-house promotion into perspective. PTR learns from search clicks, because page views are "biased by publisher promotion". Promotion on your homepage, in your notifications or on your social accounts therefore escapes this model.
- Avoid republishing. It extends the topic's visibility, but the 1492 logbook advises against it: Discover regularly demotes some sites that do it at scale, set up on old abandoned domain names that were then taken over ("expired domains").
- Measure your own curve, as the 1492 logbook suggests. In Search Console, Discover tab, compare the daily curve of your ten best articles of September with that of your ten best of February. If the first day is comparable and the tail of the following days has disappeared, you are in the case described here.
Method and limits
Our data come from a panel of Discover feeds, our test accounts' feeds, which we follow from March to October 2026, in French and in English. An article's audience is the number of its displays in these feeds. An article is a distinct URL. A card is an article displayed in a feed on a given day, so the same article can produce several cards. Counts therefore change from one measure to another. Presence over several days covers about 35,400 articles, videos and social posts excluded. Age at display only covers cards whose URL contains a date: about 23,700 across the panel, or 18% of cards, including about 15,000 for the five feeds followed every month in the monthly series. The clickbait test covers about 23,500 articles scored in spring. Categories come from headline or URL patterns. A feed's language is inferred from its settings. Most before-after comparisons set May-June against August-September 2026.
These data have limits. The panel is small, especially in French. Part of the differences may come from the season and the news. We do not see traffic on publishers' sites. The names we give to scores are our hypotheses, drawn from their behavior. Finally, a coincidence of dates proves nothing: SDF provides a plausible mechanism for the July decline, without demonstrating its cause.
Sources:
- Di Bai, Feng Han, Zhenwei Tang, Jintao Liu, Luoshu Wang, Jialu Liu. "Decomposing Staleness in Recommender Systems: A Dual-Filter Framework for Supersession and Decay". CIKM 2026, Rome. arXiv 2608.15780. DOI 10.1145/3799682.3840082.
- Di Bai, Jintao Liu, Zhenwei Tang, Peifan Wu, Nada Al-Thawr, Luoshu Wang. "Heterogeneous Ranking in Industrial-Scale Recommender Systems: A Case Study". RecSys 2026. arXiv 2607.27577. DOI 10.1145/3773078.3831848.
- Paul Covington, Jay Adams, Emre Sargin. "Deep Neural Networks for YouTube Recommendations". RecSys 2016.
- Jianling Wang et al. "Fresh Content Needs More Attention: Multi-funnel Fresh Content Recommendation". KDD 2023.
- Patent US7346839 B2, "Information retrieval based on historical data", Acharya et al., Google, granted March 18, 2008.
- Patent US8972391 B1, "Recent Interest Based Relevance Scoring", McDonnell et al., Google, granted March 3, 2015.
- 1492.vision, Discover logbook of October 8, 2026.
- 1492.vision, Inside Google Discover: How 20 Pipelines Shape the English Feed.
- 1492.vision, Google Discover cards in 2026 carry one entity per reader, Google's topics and new related-feed signals, October 2026.
- 1492.vision, Inside Google Discover's New Internal Signals, December 2025.
Data and observations: 1492.vision, based on the analysis of real Google Discover feeds and available public research. The internal mechanisms presented are our interpretations; Google has not confirmed them. Google and Google Discover are trademarks of Google LLC. We have no affiliation with Google.
- Supersession: when more recent content replaces another piece, making the information it gave obsolete. ↩
- Entity: a person, organization, place or notion that Google recognizes in a text, such as "Anthropic", "Eiffel Tower" or even "Converse polo shirt size L". ↩
- Precision: the share of articles the model judges stale that really are. Recall: the share of stale articles the model catches. F1: the average of the two (harmonic mean). ↩
- Distillation: a technique that trains a small model to reproduce a large model's answers, to get similar results at a much lower cost. ↩
- Explicit reasoning (chain of thought): the model writes out the steps of its reasoning before giving its answer. Here, the rationale is learned from the large model's answers. ↩
- Natural language inference (NLI): a task in which a model judges whether one sentence implies another, contradicts it, or is unrelated to it. ↩
- PTR (predicted traffic ratio): the predicted share of an article's lifetime traffic, received between its publication and a given horizon. ↩
- Early fusion: text, image and video are given together to the same model at the input, instead of being processed separately and then combined (late fusion). ↩
- θ (theta): decision threshold. With θ = 0.9, the article is removed when the predicted share of its lifetime traffic reaches 90%. ↩
- Amplification: the name we give to a score attached to each card, which seems to modulate the article's distribution. It is usually positive. When negative, it marks an article being held back. ↩
- Articles pushed up and down: articles that get more, or fewer, displays in the tested variant than in the control version. ↩
- Holdback group: the share of users kept without the tested feature, to measure its effect over time. ↩
- Serving scores: the name we give to the two scores that accompanied the potential score in spring 2026. They depend much more than it does on the context in which the article is served. The first varies clearly from one feed to another for the same article, with no measurable link to the card's position or to amplification. The second, which we called the serving confidence score, depends mainly on the channel recommending the article: the same article can get 0.02 in one channel and 0.96 in another. ↩
Authors
Posted on 2026-10-22
More reliable, sourced reporting on Discover? Add us to your sources!
Add to sources Add to sources