Discover logbook, October 8, 2026: since July, top articles have lost a third of their reach
Summary. An exchange on X caught our attention: has the maximum performance of a URL dropped since the start of the year? Our recent audits for national and regional publishers had already reached the same finding: their best articles "don't climb as high". Our market data confirms it in the four markets we track, France, Italy, the United States and Spain. In September 2026, the most exposed articles of each month accumulate about a third less exposure than in January-February, and the decline starts in July. An article's best day drops only slightly (−12% in France), while its exposure duration falls further: an article now stays in the French feed for 1.9 days on average, against 2.3 to 2.8 days in the first half of the year. In France, the national press loses a quarter of its share of voice and the regional press triples it.
House vocabulary
- Exposure: an article being displayed in the Discover feed, as captured by the 1492 panel.
- Reach: an article's cumulative exposure, as a share of the total exposure of articles in its language each day.
- Best day: the day on which an article reaches its highest share of that day's exposure.
- Exposure duration: the number of days an article is seen in the feed.
- Most exposed articles: the 1,000 articles with the highest best day in a given month and language.
- Share of voice: a site's share of all article exposures in its language.
- Pipeline: an internal source of the Discover feed, identified in our data.
- Index 100: the January-February 2026 average.
- National press (IPG): French national general and political news sites (16 sites tracked).
- Regional press (PQR): French regional daily newspapers (35 sites tracked).
Why this logbook
The question came from a public exchange on X. @eseoref asked whether we had statistics on the "maximum" performance of a URL between the start of the year and September-October, at a time when news publishers report a sharp drop in visits.
We already had part of the answer. Over the past few weeks, several client audits, for a large regional daily as well as national titles, reached the same finding: their most exposed articles were not climbing as high as at the start of the year, while more articles were getting exposure. So we checked whether this was true across the whole French market, then in Italy, the United States and Spain.
1. The same decline in four markets
We tracked, month by month, the reach of the 1,000 most exposed articles in each language. Until June, the four curves stay close to 100. From July, they fall together.
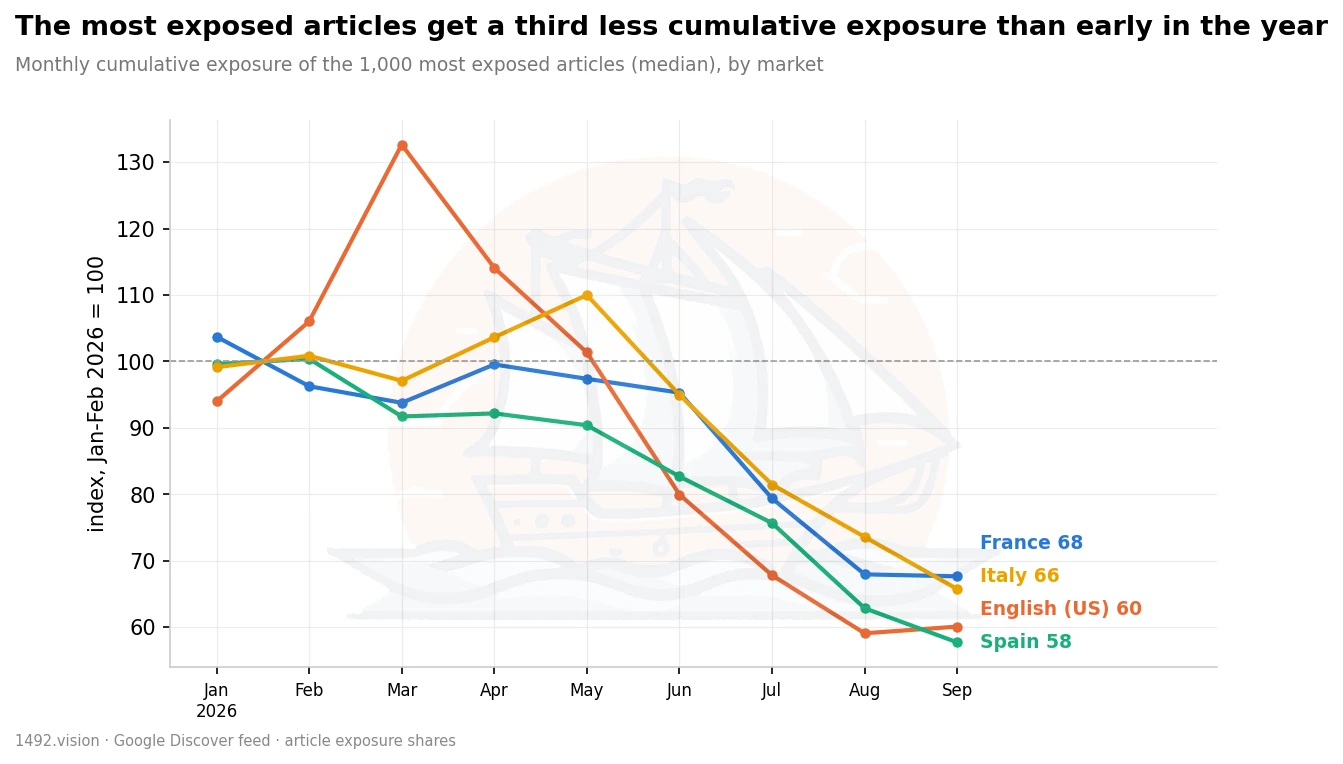
Monthly cumulative exposure of the 1,000 most exposed articles (median), index January-February 2026 = 100.
| Market | September 2026 |
|---|---|
| France | 68 |
| Italy | 66 |
| United States (English) | 60 |
| Spain | 58 |
In September, the decline ranges from 32% in France to 42% in Spain. A news cycle specific to one country would not move four markets at the same time and in the same direction. The change therefore comes from the way Discover works.
2. Articles stay in the feed for fewer days after their best day
Article level. A decline in reach comes from a lower best day, a shorter exposure, or both. In France, the two effects can be separated.
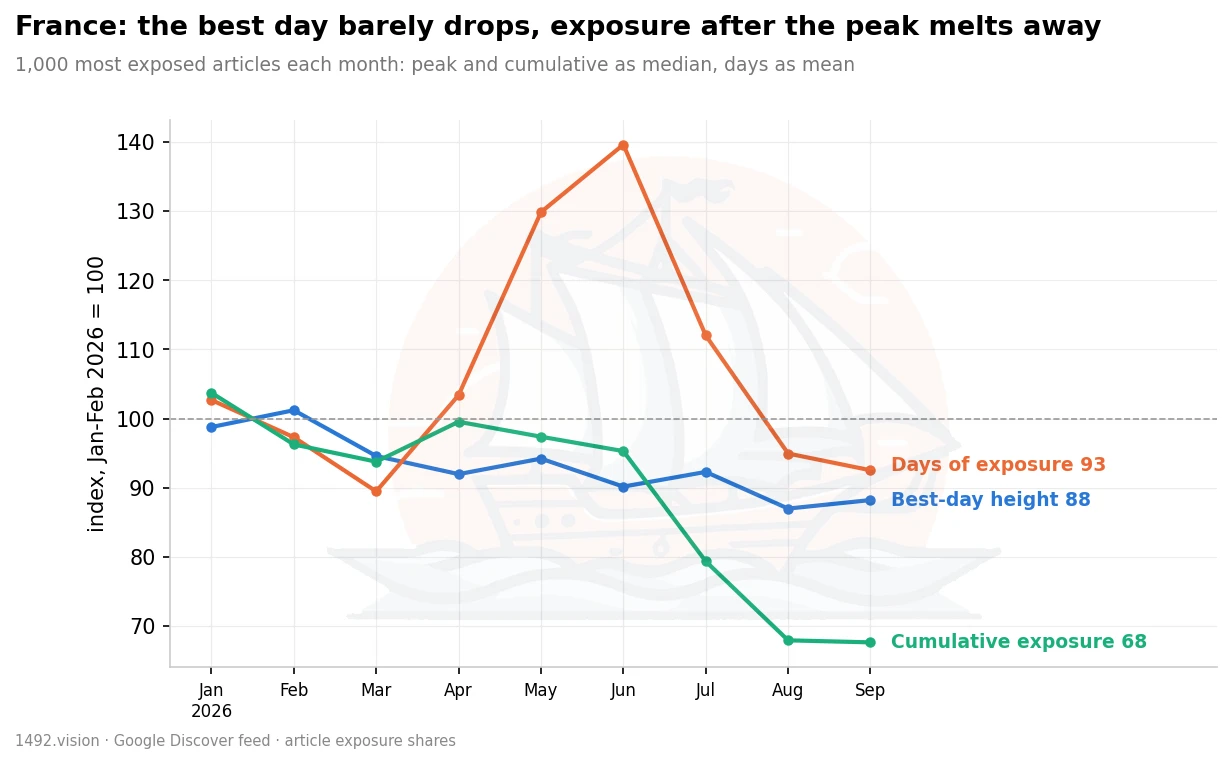
The 1,000 most exposed articles of each month in France: best day and reach as medians, duration as an average. Index January-February 2026 = 100.
In September, the best day is at 88 and reach at 68. The best day therefore accounts for less than half of the decline. The rest comes from the days that follow.
To check this, we followed two cohorts of French articles over their first ten days. The first covers articles that appeared in February, the second those that appeared in September.
| Cohort | Exposure duration | Exposure after the best day |
|---|---|---|
| February 2026 | 3.6 days | 25% of reach |
| September 2026 | 2.7 days | 17% of reach |
Articles whose best day exceeds 0.002% of that day's exposure.
A September article loses almost one day of exposure. The share of its reach obtained after its best day drops by a third.
All articles. Average exposure duration has been falling in all four markets since July. In September, it reaches its lowest level of the year everywhere.
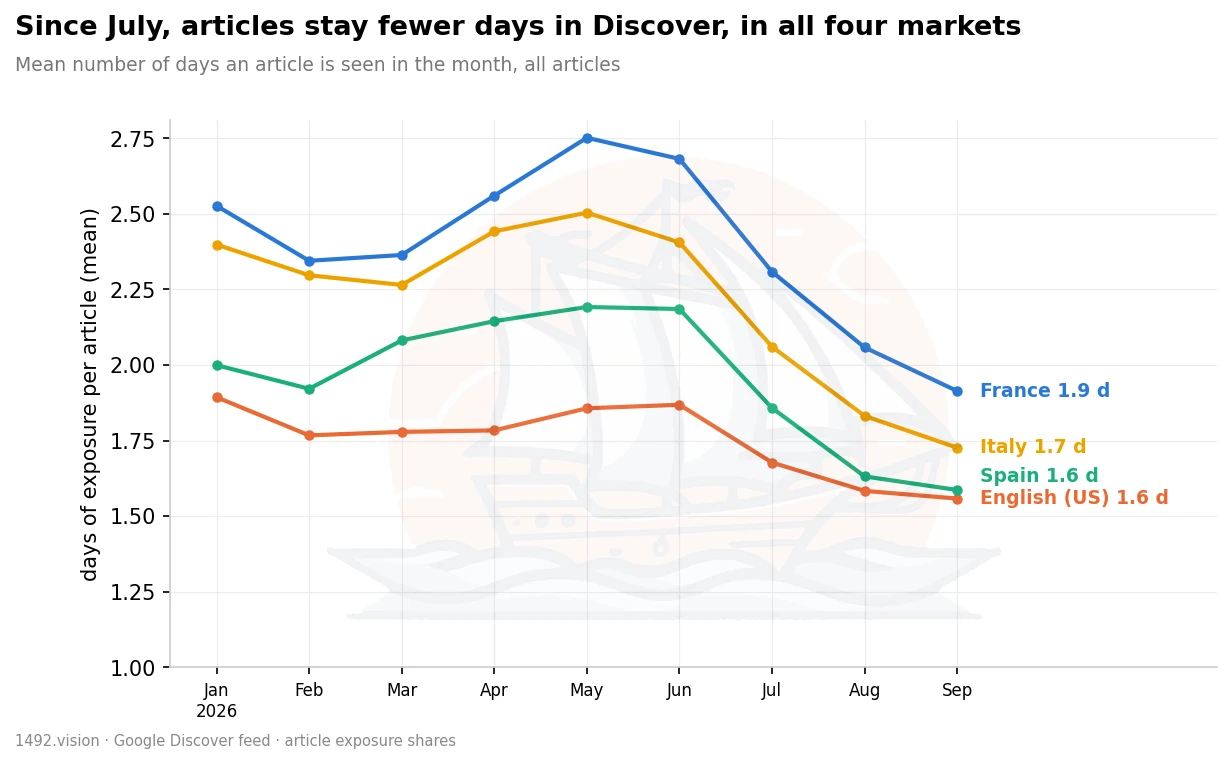
Average number of days an article is seen in the month, all articles.
| Market | June 2026 | September 2026 |
|---|---|---|
| France | 2.7 days | 1.9 days |
| Italy | 2.4 days | 1.7 days |
| Spain | 2.2 days | 1.6 days |
| United States | 1.9 days | 1.6 days |
3. A slightly less concentrated feed
Feed level. If the most exposed articles accumulate less, exposure necessarily goes elsewhere. Daily concentration decreases, modestly, in all four markets.
| Market | Top 10 share | Articles needed for half of exposure |
|---|---|---|
| France | −11% | +9% |
| Italy | −12% | +14% |
| Spain | −19% | +13% |
| United States | −40% | +16% |
September 2026 compared with January-February 2026, average of days.
In France, the day's ten most exposed articles account for 0.6% of exposure in September, against 0.7% at the start of the year. It also takes 9% more articles to reach half of the day's exposure. The feed was already diffuse. The decline in reach therefore comes mostly from exposure duration, covered in section 2.
4. The national press declines and the regional press triples its share of voice
Site level. Here we compare September with January-February for 16 national press sites and 35 regional press sites.
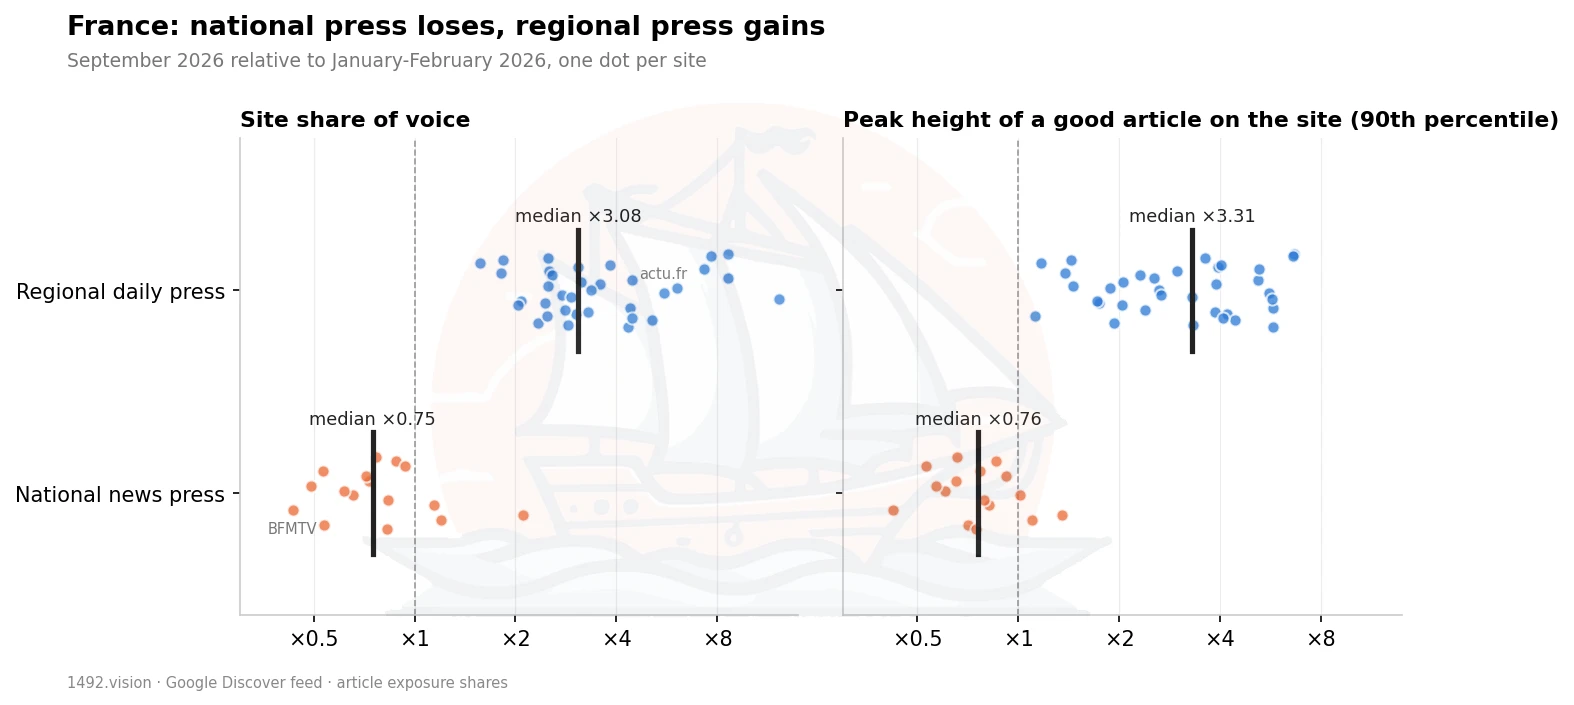
September 2026 compared with January-February 2026, one dot per site. Logarithmic scale.
| Group | Share of voice | Best day of a good article |
|---|---|---|
| National press (16) | ×0.75 | ×0.76 |
| Regional press (35) | ×3.1 | ×3.3 |
"Good article": 90th percentile of the site's articles, ranked by best day.
The national press loses both share of voice and best-day height. The regional press gains on both measures. None of the 35 regional titles we track has declined since the start of the year.
- Its gains come from the general feed. The share of its exposure coming from local pipelines, geotargetingstories and webkicklocalstories, goes in median from 12.7% in February to 1.6% at the end of September.
- Titles that relied most on local pipelines gain a little more. In February, local pipelines made up a larger part of their exposure, and they have grown more since then (rank correlation of 0.46 across 34 sites; 0 would mean no link, 1 the same ranking).
One hypothesis is circulating: national titles that publish in high volume would be hit hardest. Our data confirms the first half, the national press is losing. It does not allow us to measure the role of publishing volume.
5. A large regional daily gains on its mid-range articles
Single-site level. The finding from our audits shows up clearly at a large regional daily. The chart compares two measures: the best day of its ten best articles of the month, and that of a good article (90th percentile).
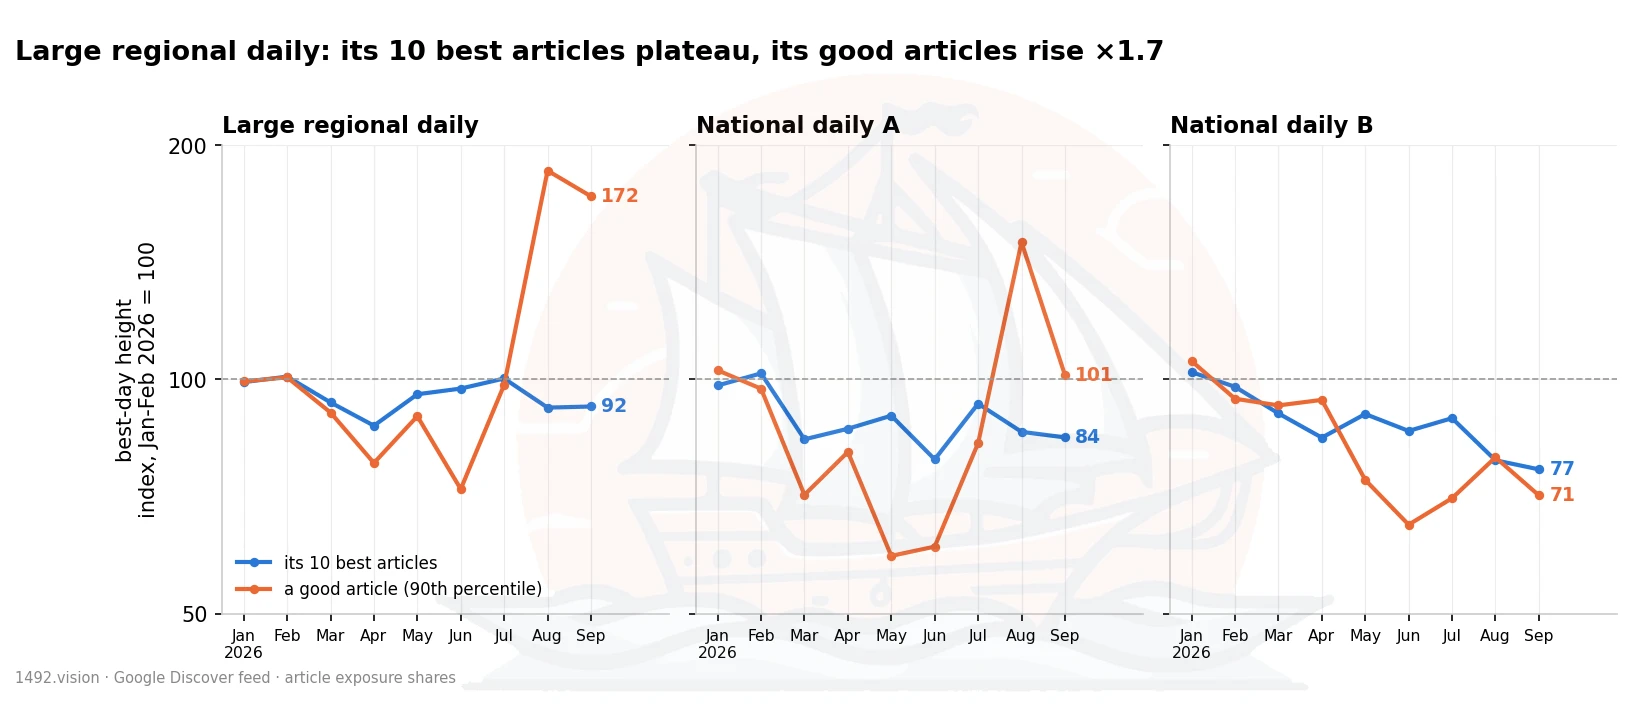
Best day of the month's 10 best articles (median) and of a good article (90th percentile), index January-February 2026 = 100. Logarithmic scale.
| Site | 10 best articles | Good article |
|---|---|---|
| Large regional daily | 92 | 172 |
| National daily A | 84 | 101 |
| National daily B | 77 | 71 |
September 2026, index January-February 2026 = 100.
At the regional daily, the ten best articles stay slightly below their start-of-year level. A good article climbs 1.7 times higher. The site has fewer very big articles and many more well-exposed mid-range articles. At the two national dailies, the best articles decline and mid-range articles do not make up for it.
6. Evergreen content loses the most exposure duration
Within sites. We took the French February and September cohorts again, grouped by type of content. The content that used to stay longest in the feed loses the most.
| Content | Duration in February | Duration in September | Change |
|---|---|---|---|
| Gardening | 5.4 days | 3.3 days | ×0.55 |
| Recipes | 5.3 days | 3.4 days | ×0.56 |
| News | 3.3 days | 2.6 days | ×0.77 |
| Sport | 2.6 days | 2.2 days | ×0.82 |
Exposure duration over the first ten days. Change: median of site-by-site changes.
In February, a gardening tip stayed in the feed twice as long as a sports article. In September, the gap is down to one day. Every category converges towards two to three days of exposure, as if Discover kept each article for fewer days after publication, whatever the topic.
Personal stories, retirement, gardening: across the market, their exposure duration drops by 22 to 40%. At a women's magazine that grew strongly on these topics in September, personal stories stay in the feed for 2.8 days, like the average. Its gain comes from the reach of each article.
In our data, only one practice keeps a topic in the feed longer: republishing the same headline under a new URL. Each URL disappears as fast as the others, but the topic stays visible about 50% longer. Some expired domains that publish at scale do this, and Discover regularly demotes them. It is a risky game, and we do not recommend this practice.
7. Checks to run on your own data
- In Search Console, Discover tab, compare the daily curve of your ten best September articles with that of your ten best February articles. If the first day is comparable and the tail of the following days has disappeared, you are in the case described here.
- Look at your best articles and your mid-range articles separately. If the former decline and the latter rise, your profile matches the regional press. If both decline, it matches the national press.
- Date the break on your own curve. At market level, it starts in July.
- Stop counting on the long exposure tail of evergreen content. In September, a practical tip stays in the feed barely longer than a news item.
With custom 1492.vision reports, we can measure the reach and exposure duration of your articles against your market.
Method and limits
Data. The data comes from the Discover captures of the 1492 observatory. It covers articles in French, English, Spanish and Italian, from January to September 2026, with daily data up to and including October 7; this logbook was written on October 8. All values are shares or indices. Videos, ads and social networks are excluded. Incomplete capture days are excluded, including March 17, 2026.
Measures. An article's reach is the sum of its daily shares of exposure. It is computed within the month, so an article that straddles two months is split in two. This bias is the same every month. The cohorts in sections 2 and 6 follow articles over their first ten days, with no month cut-off.
Site groups. We built the national press (16 sites) and regional press (35 sites) lists ourselves. Medians are computed site by site, without adding up volumes. The content category comes from headline patterns (gardening, recipe, retirement, personal story) or from an automatic topic classification.
Limits.
- The link between reliance on local pipelines and the growth of regional titles is based on 34 sites: the correlation is weak.
- Our data measures exposure in the feed, without clicks or traffic. It does not show whether Discover, overall, serves more or fewer impressions.
Posted on 2026-10-08
More reliable, sourced reporting on Discover? Add us to your sources!
Add to sources Add to sources