Deep dive: how Discover predicts your attention (scores, personalization, embeddings)
Every card in your feed carries predictions
Open Discover. Every card you see, and every card you will never see, has been evaluated by a battery of models predicting your behavior: will you stop, click, read in depth? These predictions exist, they are quantified, and for months we have been observing their traces on real feeds.
This article details what we have learned from these scores: how they are structured, how they match real behavior, and why personalization, far more than the topic of an article, decides amplification. The vocabulary itself is now public: a recent Google job posting for its « Discover Ranking » team names the system's building blocks in plain sight: "retrieval, prediction, ranking, embedding". We describe here the measurable traces of the last two. Our sources and limits are gathered at the end of the article, in the Methodology section.
Nine scores, two dimensions
The starting fact: every Discover card carries a set of prediction scores, probabilities between 0 and 1. We have isolated about nine of them. We first mentioned them publicly in late 2025 as "multi-objective scores" (see Inside Google Discover's New Internal Signals, December 2025). Back then, it was impossible to tell what each one meant. Since, by cross-referencing a lot of data, we have been able to assign them roles, with varying levels of confidence.
Despite their number, these scores essentially collapse into two independent dimensions:
- An attention axis, a property of the article. It answers the question "will the user stop on this card?". It varies little from one user to another for a given article. It groups a visual-stop score and its near-perfect mirror, a "scroll-past" score (the risk that the card gets passed without a glance).
- An engagement axis, a property of the user-content pair. It answers "will this user click, read deeply, interact?". It varies a lot from one user to another for the same article. It groups a deep engagement score and a reading depth score.
The two axes are barely correlated: they measure different things. A headline can capture attention without engaging (the classic clickbait pattern), or deeply engage a niche without catching the majority's eye.
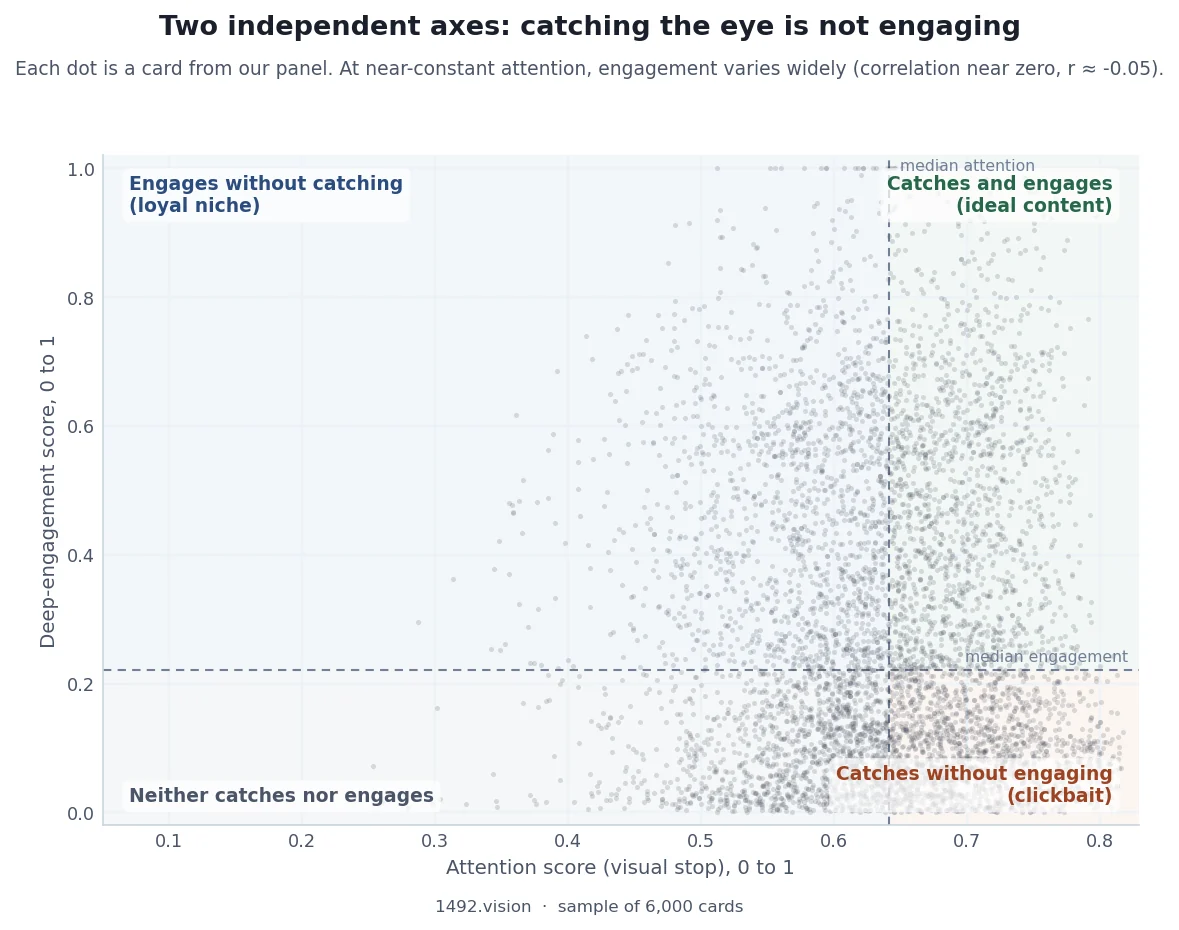
Each dot is a card from our panel, positioned by its attention score (horizontal) and its predicted deep engagement score (vertical). The two vary almost independently (correlation close to zero). Top right, content that captures and engages. Bottom right, content that catches the eye without retaining (the clickbait pattern). Top left, content that engages a niche without capturing the majority. Lines mark the panel medians.
Predictions calibrated on real behavior
Far from decorative, these scores align, in our measurements, with observed engagement:
- The higher the predicted deep engagement score, the higher the observed interaction rate on our panel, with a ratio of about 2 between the bottom and the top of the scale.
- The scroll-past score goes the other way: the higher it is, the less the card gets consulted, with a steady, continuous slope.
- Combined (high engagement depth and low scroll-past), the observed interaction rate roughly doubles again.
The relative trends are clear: Google's predictions match the behavior we then observe.
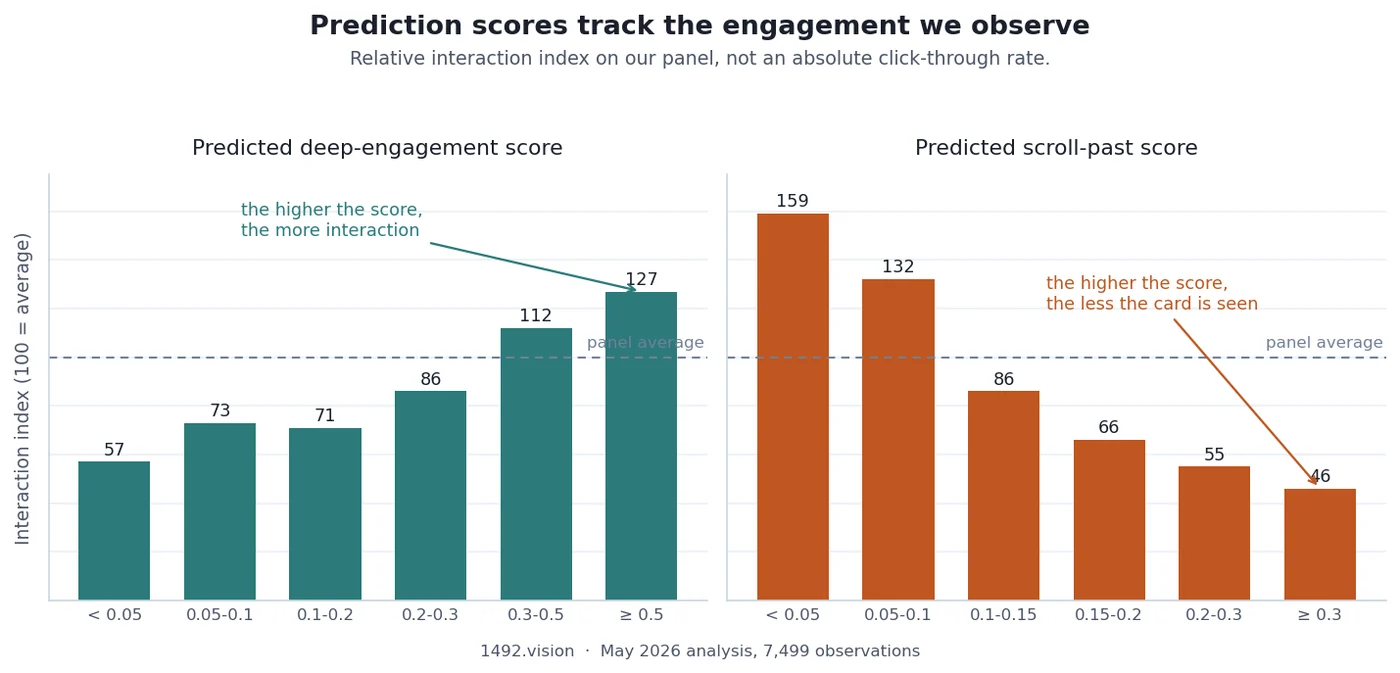
Relative interaction index on our panel (100 = average), May 2026 analysis. Left, the predicted deep engagement score: interaction rises with the score, with a ratio of about 2 between bottom and top. Right, the scroll-past score: interaction falls steadily. These are relative trends, not absolute click-through rates.
Personalization is the real story
First, the best predictor differs from one user to another. On some of our accounts, the attention score anticipates the click best. On others, it is engagement depth. Google appears to weight its models according to each profile's own behavior, rather than applying a single recipe.
Second, the affinity between a reader and a source raises the predicted engagement scores for that content, which raises amplification, which brings more impressions. The Follow button is one of the signals feeding that affinity; the two examples below show that it takes more than that. The loop reinforces itself and structurally favors the sources a reader already has history with, even when a less familiar competitor offers content of comparable potential.
First example, on our test accounts. Take two sports publishers, on the same vertical and the same accounts. Their topic potential, measured by an engagement score computed upstream of personalization, is of the same order. But one of the two is far more present in the feed and, above all, the model predicts it as more engaging for these readers. Result: its predicted deep engagement is about 2 times higher, and its final amplification about 8 times stronger. At equal topic potential, the personalized prediction (will this specific reader engage?) drives amplification, well beyond the article's topic. The striking detail: the dominant publisher is the one fewer of our panel accounts follow, via Google's Follow feature. What matters is the affinity already installed between these readers and the source, more than the declared follow. We present this case as an illustration on a small sample.
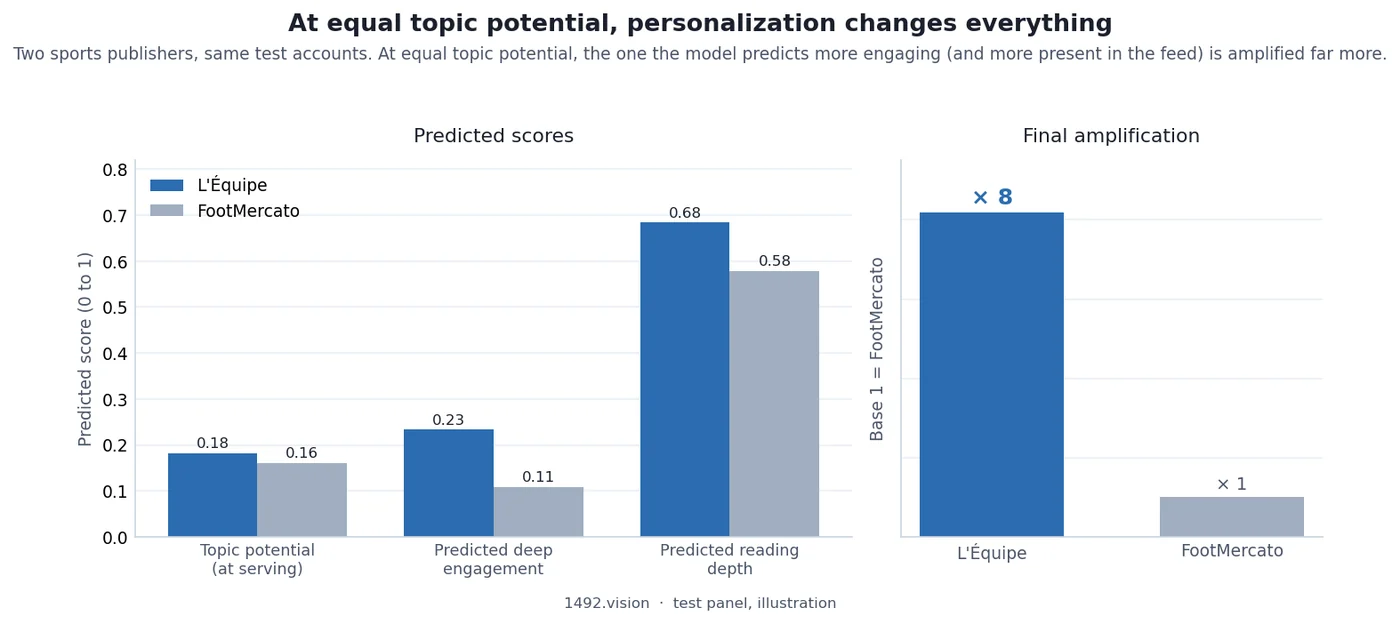
On our test accounts, two French sports publishers with near-identical topic potential. The one the model predicts more engaging (L'Équipe) gets a predicted deep engagement about 2 times higher and a final amplification of around 8 times, even though our panel accounts follow it less than the other.
The same test, replicated on a US panel with two American sports publishers (ESPN and the league's official site, NFL.com), shows the same mechanics with a more modest effect: higher predicted deep engagement (0.22 versus 0.13) and a final amplification of 1.28x for the source the model predicts more engaging, at comparable topic potential. The magnitude varies across markets and panels; the direction holds.
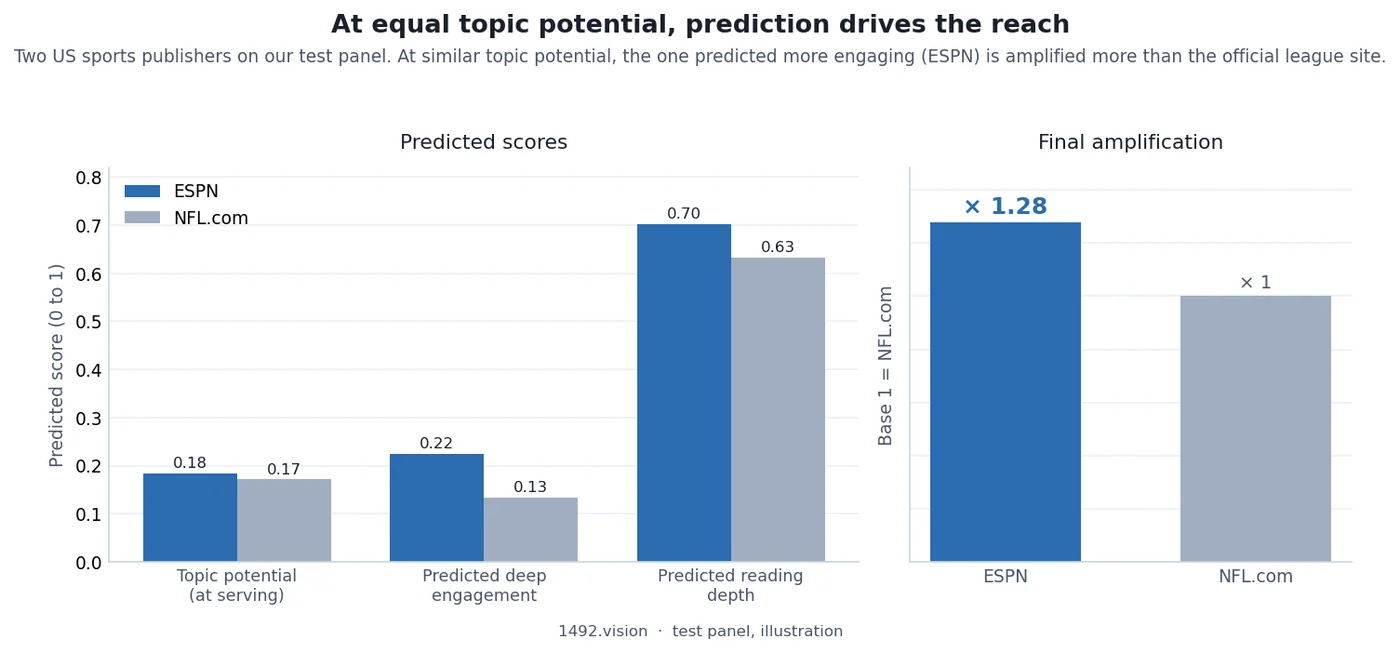
US panel replication: ESPN versus NFL.com, at comparable topic potential. Same direction as the French case, with a more modest gap (1.28x amplification).
Second example, in mirror: the weight of the follow at constant source. For a single tech publisher (9to5Google), at equal topic potential, the accounts that follow it get a predicted deep engagement almost twice that of the accounts that do not, a slightly higher reading depth, and a slightly higher amplification. Taken alone, the Follow button acts as one signal among others feeding the affinity; added to an existing history with the source, it pulls the engagement prediction up markedly. It mirrors the first case: affinity makes the decision, the follow contributes to it.
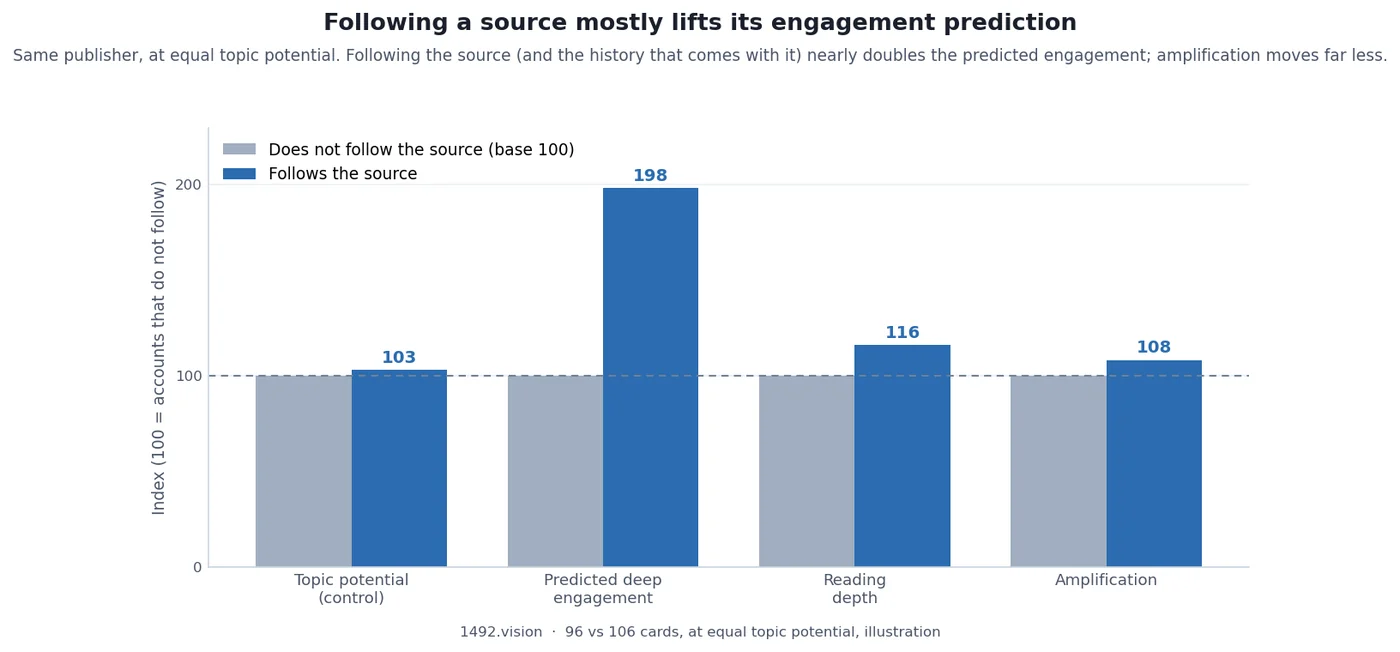
Same publisher (9to5Google), on our test accounts, at equal topic potential. Base 100 = accounts that do not follow the source. The accounts that follow it show a nearly doubled predicted deep engagement, a slightly higher reading depth and a slightly stronger amplification, while topic potential stays identical (the control).
"Engaging" is not "useful"
Google itself distinguishes, in its communication as in its published research, engagement from satisfaction: clicking and staying is not the same as being satisfied. These scores carry the engagement side. The "useful" side (quality, actual satisfaction) appears to be carried by other signals. A high engagement score therefore tells only half the story.
Upstream of predictions: how the user is represented
To predict, the system needs a compact representation of the user and the content. These are embeddings1: vectors of numbers that place similar users and similar content side by side.
Our observations converge: Google appears to maintain several families of representations per user, rather than a single vector, each on its own time window and usage:
- Discover interests, as a main profile plus a short-term variant, a family we spotted under the internal name "Astria",
- a trends-oriented family, "Hobbes",
- a real-time family, "Deep Now",
- a family, "Monet", first spotted on the shopping side. A retrieval channel of the same name also appears behind AI summary cards on finance and tech press, which suggests a use broader than shopping alone. The connection rests on the channel name only: a lead to follow.
These vectors feed a so-called "two-tower" retrieval2: one tower for the user, one tower for the content, and a recommendation is born from proximity between the two in the vector space.
Beyond these families, Google also appears to keep a distinct profile per retrieval channel, and to learn which channels serve each user best: on top of multiple representations of the person, a form of memory of which channels suit them.
"Monet" also seems to rely on "orthogonalized" embeddings, designed to resist manipulation: an artificially inflated signal stops influencing recommendations, without the content being flagged as undesirable (according to public Google work on this type of embeddings).
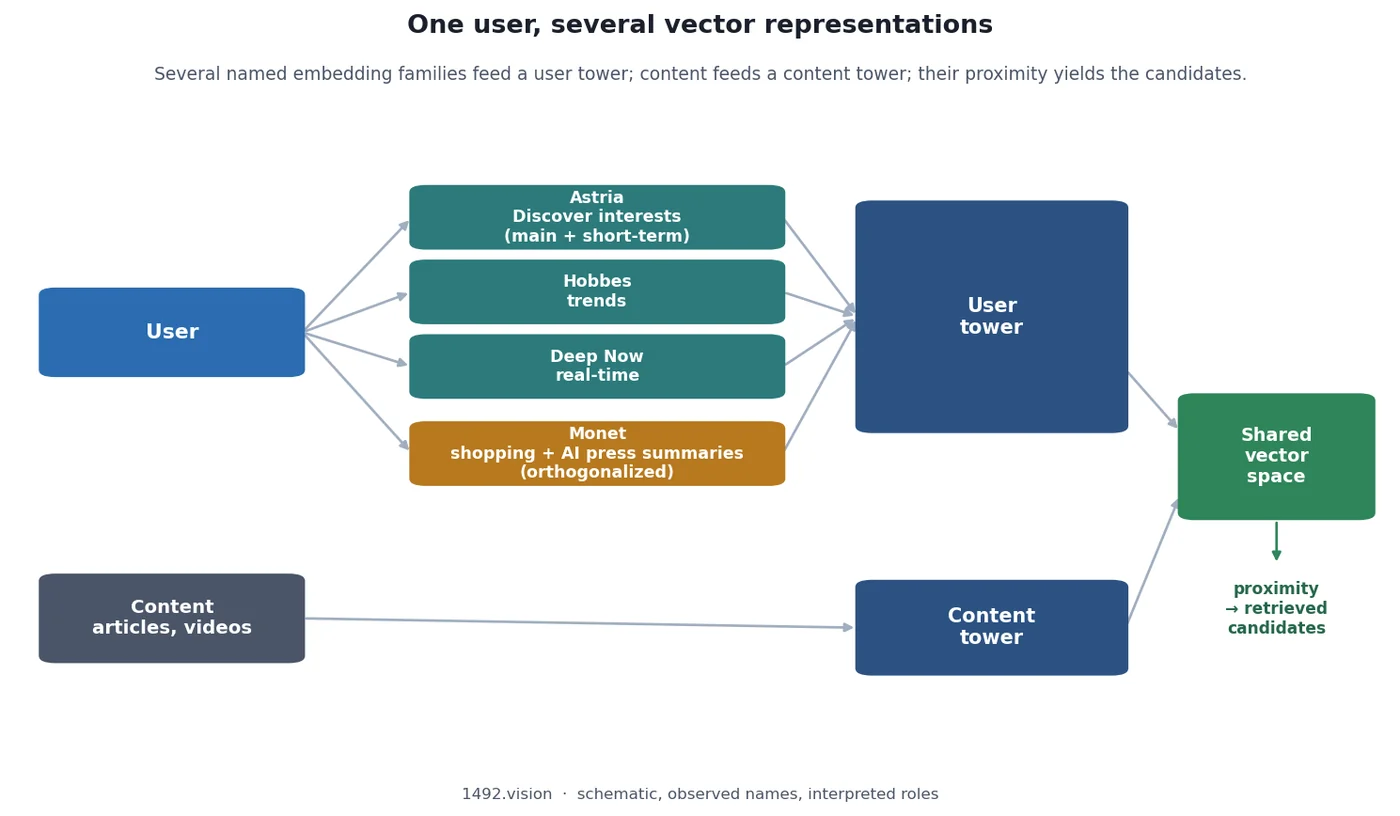
The user is represented by several named embedding families (Astria for Discover interests, main profile and short-term variant, Hobbes for trends, Deep Now in real time, Monet, orthogonalized, spotted on shopping and, under the same name, behind AI press summaries). These vectors feed a user tower; the content feeds a content tower; the proximity of the two in a shared vector space produces the retrieved candidates. Diagram: observed names, interpreted roles.
What this changes for a publisher
Three practical consequences stand out:
- Installed affinity drives amplification. At equal potential, the personalized prediction, fed by the history between reader and source, makes the difference. Building loyalty (repeat reads, interactions, follows) is a measurable lever for the distribution of your content in the feeds and, in our tests, it outweighs the declared follow via the Follow button.
- Attention and engagement are worked on separately. A headline that captures without retaining feeds the wrong axis; deep content that never stops the eye never enters the loop. Since the two axes are nearly independent, so are the diagnostics.
- Engagement is only half the story. Satisfaction signals live alongside; optimizing clicks at the expense of satisfaction wins one axis while losing the other.
These mechanisms are still moving. We will keep tracking them, card after card. That is how we navigate: without the ship's blueprints, but logging every signal that passes, and keeping the chart up to date.
Methodology and limits
Our observations come from a panel of test accounts tracked over time, on real Discover feeds (score analysis: May 2026). "Follow" is meant throughout as Google's Follow feature, measured on our panel accounts. The labels given to the scores (attention, scroll-past, deep engagement, reading depth) are our hypotheses, based on their behavior: we do not know what Google calls them, and at least two scores still resist a clean reading. Absolute values depend on our measurement method; only the relative trends should be relied on. The publisher cases (L'Équipe/FootMercato and ESPN/NFL.com for personalization, 9to5Google for the follow) are illustrations on small samples: they show a mechanism, they do not prove it at scale. The embedding family names (Astria, Hobbes, Deep Now, Monet) are observed; the roles we assign them are interpretations, and the Monet shopping/press connection rests on the channel name alone. Some points will remain undecidable from the outside; wherever we cannot settle a question, we say so. Data and observations: 1492.vision, based on the analysis of real Google Discover feeds and publicly available research; the internal mechanisms presented are our interpretations, not confirmations from Google. Google and Google Discover are trademarks of Google Inc. We have no affiliation with Google.
- Embedding: the representation of an object (user, article, video) as a vector of numbers, such that two objects close in that space are considered similar by the system. ↩
- Two-tower retrieval: an architecture where one model encodes the user on one side and the content on the other, relevance being measured by the proximity of the two vectors. ↩
Authors
Posted on 2026-08-18
Plus d'infos fiables et sourcées sur Discover ? Ajoutez-nous aux sources !
Ajouter aux sources Ajouter aux sources