Discover logbook, September 22, 2026: after the freeze of the 15th, a change that lasts
Summary. For a week now, publishers have been saying they "dropped out of Discover" overnight. Our data confirms something happened, but not a wave of exits. Two events followed each other. On September 15, Discover stopped admitting fresh articles for ten hours; the incident was fixed the next morning. And between the 14th and the 17th, the feed changed structure: the relatedcontentruby pipeline, which serves "related articles", went from 13-15% to 24-28% of cards in the five languages we track, at the expense of classic pagination. The result: no more disappearances than usual, but up to three times more sites see their share of voice cut by five within 48 hours, mostly sites with no exposure through aura.
House vocabulary. Pipeline: an internal source of the Discover feed, identified in our data. Card: a display unit of the feed (article, video…). Here, we only count article cards. Share of voice: a site's share of all cards captured by the panel. 1492 panel: our panel, which captures realistic Discover feeds. Discover weather: our daily score measuring how much the feed changed from one day to the next.
All values are shares (% of cards, share of voice) or ages. Scope: article cards, 1492 panel, five languages.
1. Timeline: the 15th, the 16th, then a new regime
Recap: on September 15, between 07:15 and 17:30 UTC, Discover kept serving the same volume of cards without letting new articles in (report of the 15th, addendum of the 16th). By the morning of the 16th, the age of served articles was back to normal.
The Discover weather records both days. In French, the score rises to 6.3 on the 15th and reaches the red threshold (7.0) on the 16th. Italian (5.0) and Spanish (4.3) peak on the 16th; English reacts on the 15th (4.1) and again on the 18th (4.9). German barely moves.
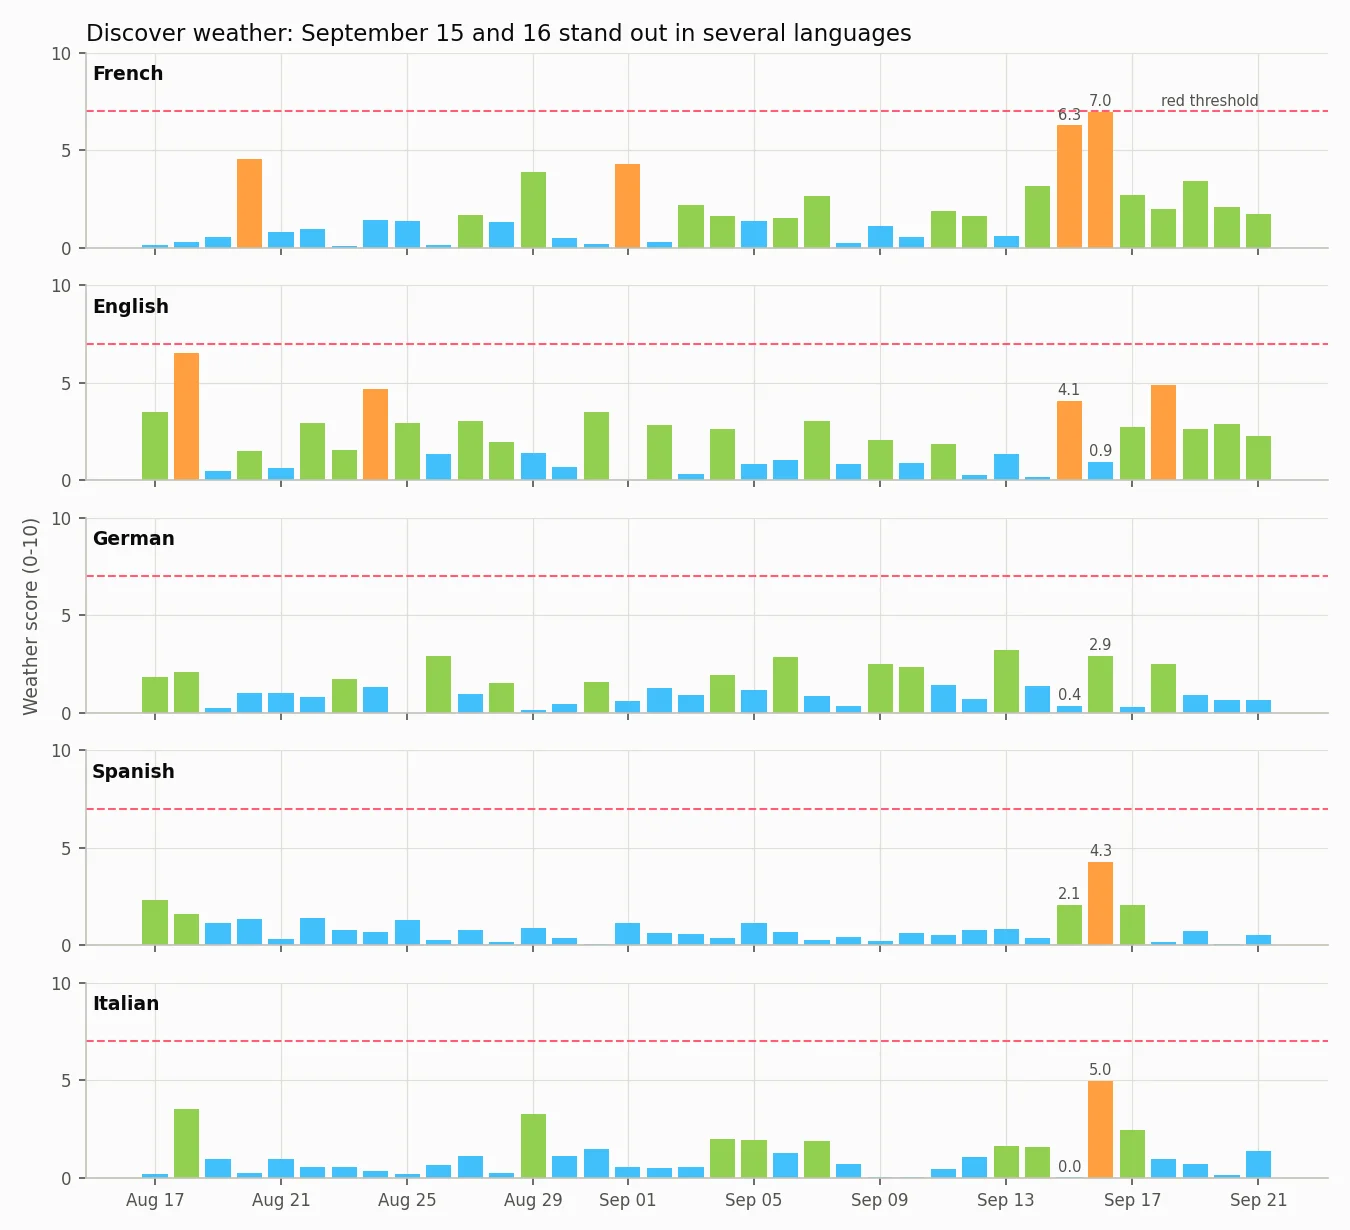 Figure 1: The weather, five languages: the spike of the 16th, English shaken twice.
The spike of the 16th has two sources. The weather measures day-to-day changes: on the 16th, fresh articles come back all at once (the reverse of the 15th) and, at the same time, another shift begins. That shift is what we document here.
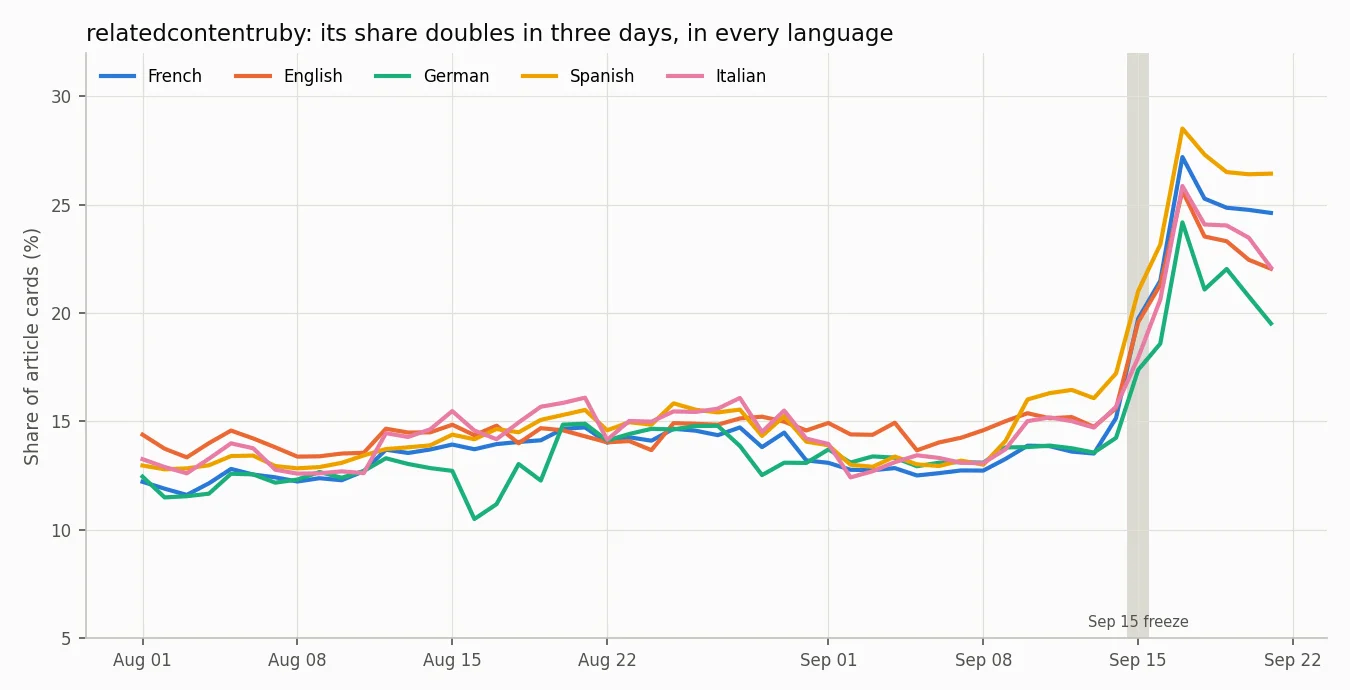 Figure 2: relatedcontentruby's share per day: the break starts on the 14th, the peak falls on the 17th.
All summer, relatedcontentruby accounted for 13 to 15% of article cards, in all five languages. From September 14 its share rises; on the 17th it reaches 24 to 28% depending on the language. It then eases by two to five points without returning to its summer level: on September 21 it still stands between 19.5% (German) and 26% (Spanish). The five curves move on the same day. Five markets don't move together because of local news: this is a change on Google's side.
2. Winners and losers among pipelines
We compare two windows: August 31 to September 13 (before), and September 17 to 21 (after the freeze and the catch-up). All figures in this section are shares of the whole feed.
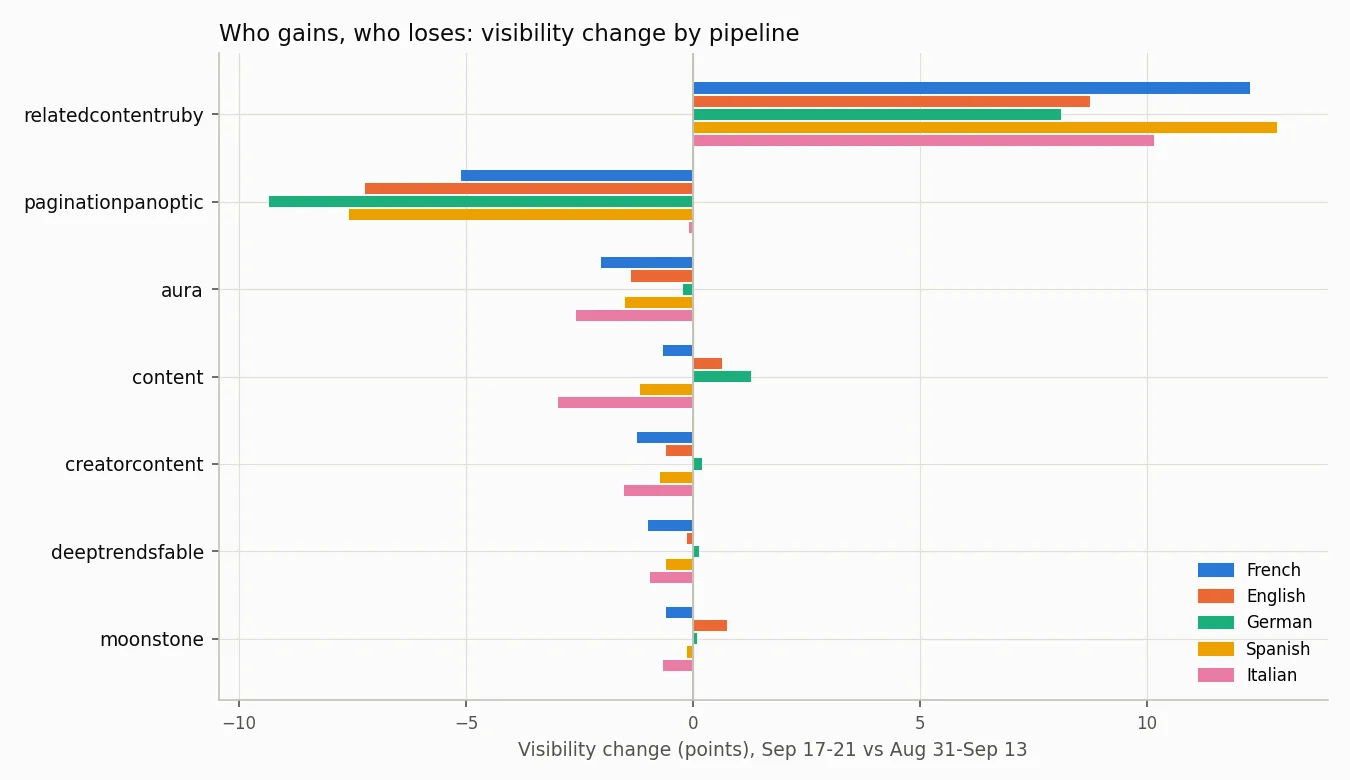 Figure 3: The shift by pipeline: pagination gives way, ruby takes over.
| Language | relatedcontentruby | paginationpanoptic | aura |
|---|---|---|---|
| French | 13% → 25% | −5.1 pt | −2.0 pt |
| English | 15% → 23% | −7.2 pt | −1.4 pt |
| German | 13% → 22% | −9.3 pt | −0.2 pt |
| Spanish | 14% → 27% | −7.6 pt | −1.5 pt |
| Italian | 14% → 24% | −0.1 pt | −2.6 pt |
Three readings:
- relatedcontentruby gains 8 to 13 points everywhere. In our taxonomy, it is a "related articles" slot placed high in the feed.
- paginationpanoptic, the largest pipeline in Discover (the one for scroll continuation), gives up most of those points, except in Italian where it holds steady.
- aura, a broad, general recommendation closely tied to content, loses 1.4 to 2.6 points, except in German. content barely moves (−1.2 to +1.3 points), except in Italian (−3.0 points); creatorcontent and deeptrendsfable lose 1.5 points at most.
Within sites. Mind the scale: everything above measures the whole feed. Within a typical site, the rise of relatedcontentruby is more modest: +2.7 points for the median site in French, +3.7 in English, +6.8 in German, +8.4 in Spanish, +6.1 in Italian. In calm periods, the same calculation gave +2 points at most. Conclusion: 77 to 100% of the feed-level gain, depending on the language, comes from this rise within sites; the rest comes from visibility moving between sites.
And this within-site gain benefits large sites first: in them, relatedcontentruby grows much more than in the median site, especially in French and English. For aura, the within-site decline clearly exceeds calm periods only in Italian and English.
3. Older articles served, a gap that is narrowing
The median age of an article when it is shown jumps on the 15th (the freeze), falls back on the 16th, then stays above its usual level. This fits the rise of relatedcontentruby, which serves more of yesterday's articles than the admission pipelines do.
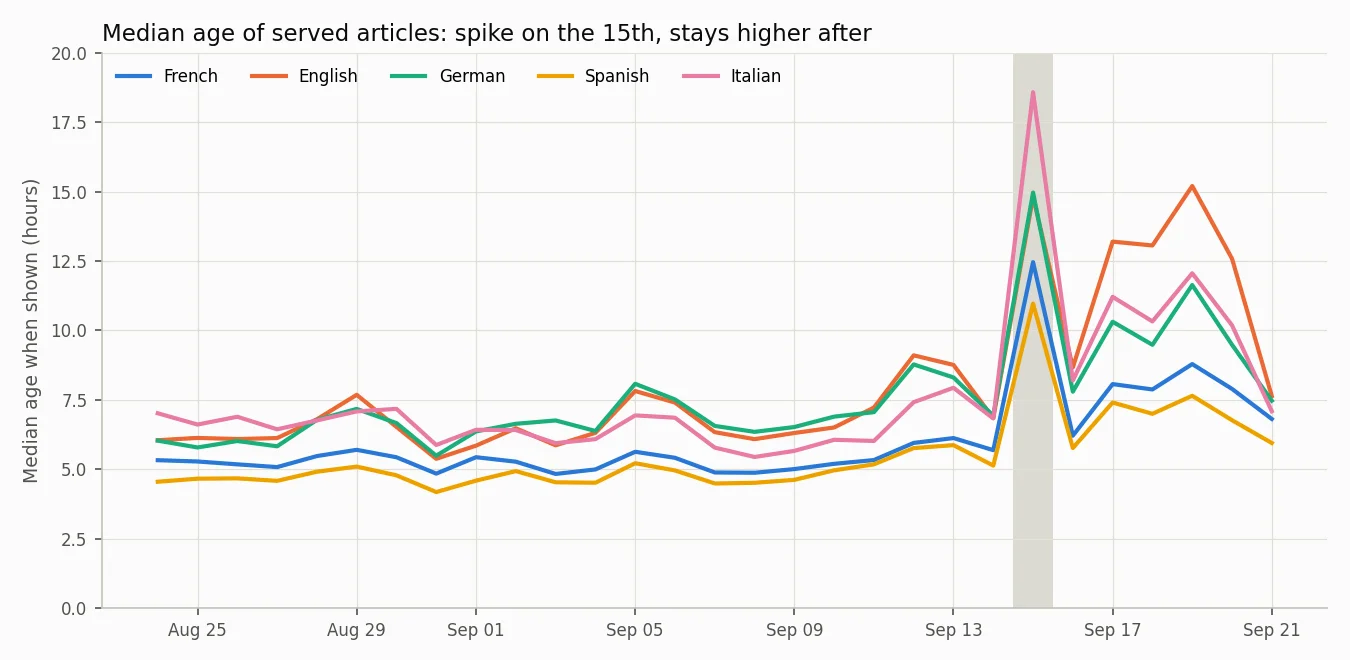 Figure 4: The age of served articles: the freeze spike, then a plateau above normal.
| Language | Thu-Fri Sep 10-11 | Thu-Fri Sep 17-18 | Mon Sep 21 |
|---|---|---|---|
| French | 5 h | 8 h | 7 h |
| English | 7 h | 13 h | 8 h |
| German | 7 h | 10 h | 8 h |
| Spanish | 5 h | 7 h | 6 h |
| Italian | 6 h | 11 h | 7 h |
The gap narrows sharply on Monday the 21st: article age may return to normal faster than the pipeline split, which is still holding.
4. Out of Discover? Crushed, rather
Some comments talk about "exits". We measure two distinct things, for sites with at least 20 captures a day. A site that dropped to zero gets no card at all over the whole week. A crushed site sees its share of voice cut by five or more over the week of September 15 to 21, compared with the two previous weeks. Each rate is compared with the same measure over two calm periods (late July and mid-August), because sites leave Discover every week.
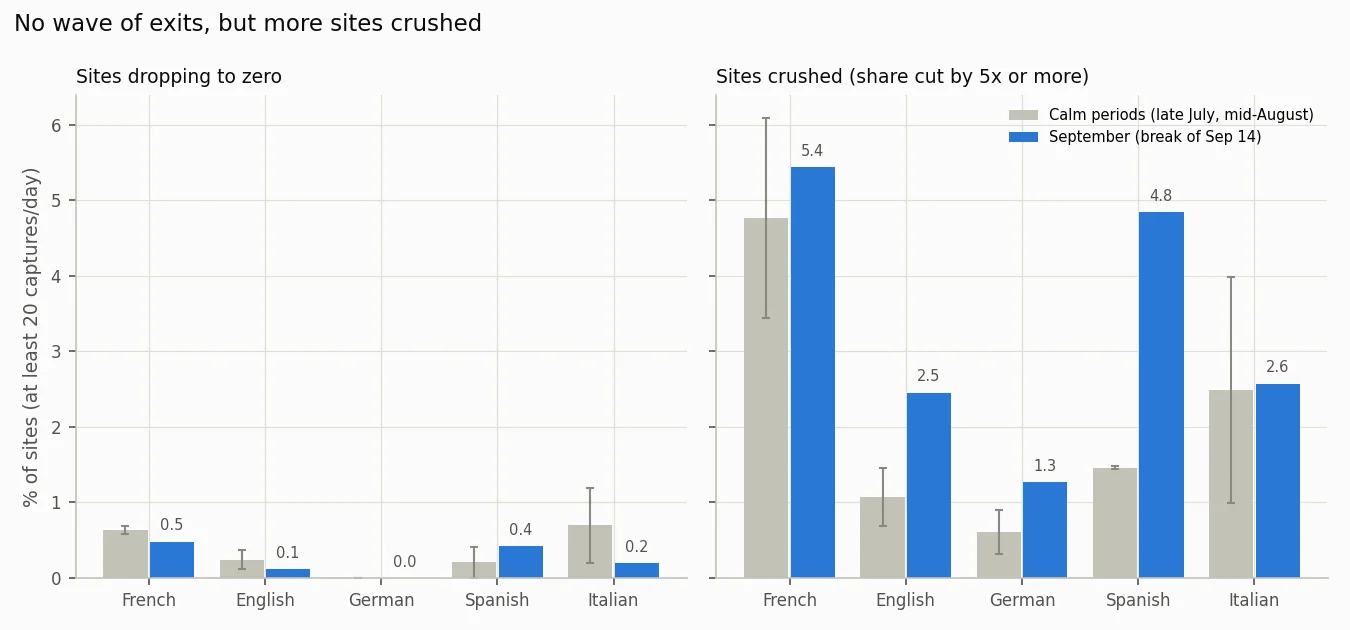 Figure 5: on the right, crushed sites exceed their normal level in Spanish, English and German; on the left, sites dropping to zero stay within normal everywhere.
| Language | Dropped to zero | Normal | Crushed | Normal |
|---|---|---|---|---|
| French | 0.5% | 0.6-0.7% | 5.4% | 3.4-6.1% |
| English | 0.1% | 0.1-0.4% | 2.5% | 0.7-1.5% |
| German | 0.0% | 0.0% | 1.3% | 0.3-0.9% |
| Spanish | 0.4% | 0.0-0.4% | 4.8% | 1.4-1.5% |
| Italian | 0.2% | 0.2-1.2% | 2.6% | 1.0-4.0% |
Two conclusions:
- No wave of exits. Sites dropping to zero are no more frequent than in calm periods, in any language. In French and English, we repeated the measure over 68 rolling windows since July: September is below average.
- More sites crushed, mostly in Spanish and English. Spanish triples its normal rate (4.8% vs 1.5%), English doubles it. French stays within its usual range, which is already wide; so does Italian. German barely moves.
For a publisher, a share of voice cut by five in two days is a worst-case scenario. The four curves below, anonymised, show what it looks like.
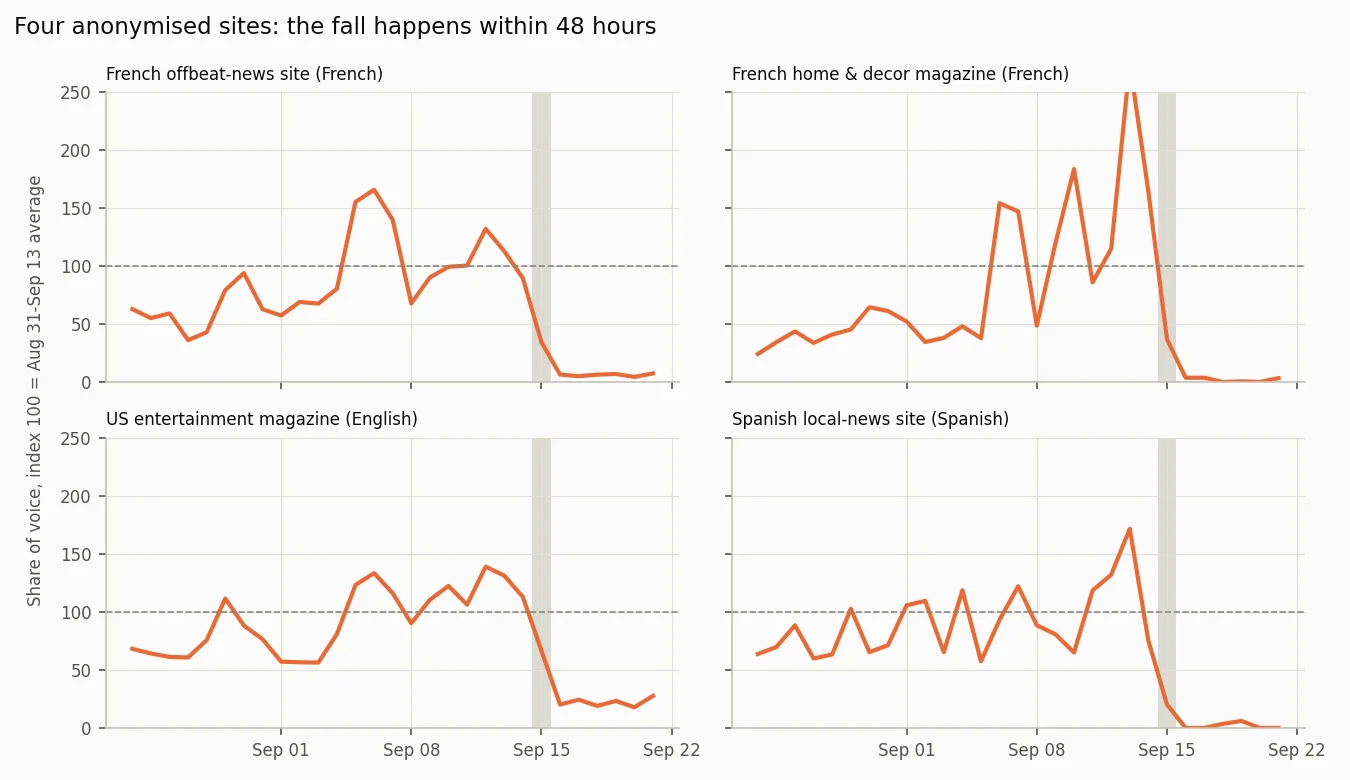 Figure 6: Four crushed sites: days above their average, then the cliff of September 15-16.
None of these sites was declining: all four had just spent a few days above their average. The fall happens on September 15 and 16, and it holds all week.
5. Who falls behind: sites without aura, at equal size
We call a site "fallen behind" when its share of voice is cut by half or more over the week. For each site, we looked at the share of its cards that came through aura before the break. Sites that got almost none (under 2%) fall behind far more than the others. Since these sites tend to be smaller, the comparison is made separately for the top 200 sites of each language and for the rest, so the aura effect is not confused with a size effect.
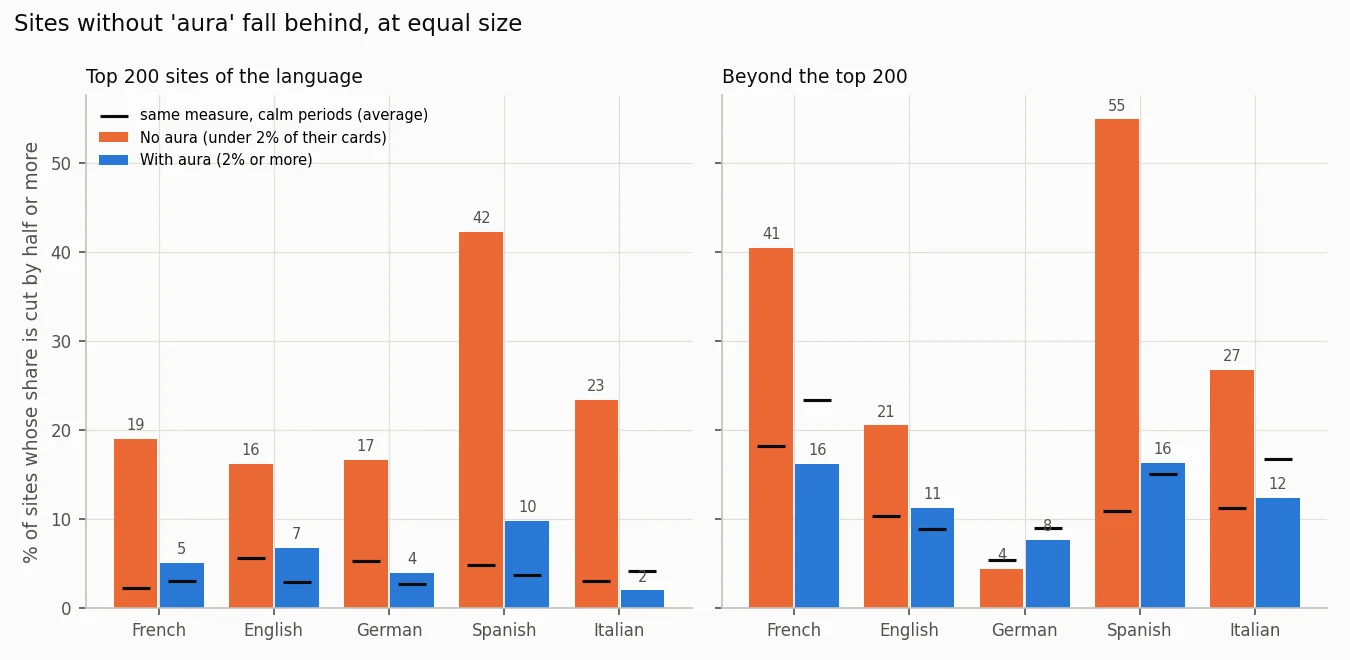 Figure 7: in September, the orange bars (no aura) clearly exceed the blue ones; in calm periods (black dashes), both groups stay close.
Share of sites that fell behind, beyond the top 200:
| Language | No aura | With aura | Gap in calm periods |
|---|---|---|---|
| Spanish | 55% | 16% | −4 pts |
| French | 41% | 16% | −5 pts |
| Italian | 27% | 12% | −6 pts |
| English | 21% | 11% | +2 pts |
| German | 4% | 8% | −4 pts |
In calm periods, both groups fall behind at the same pace; sites without aura are often slightly more stable. In September, they fall behind 1.9 to 3.4 times more often than sites exposed through aura, in Spanish, French, Italian and English. The same gap shows among the top 200 sites (for example 42% vs 10% in Spanish, 23% vs 2% in Italian), on smaller counts. German is the exception, consistent with aura holding steady in that language.
These sites did not depend more on paginationpanoptic, the pipeline that shrank the most: it made up 28 to 37% of their cards (median by language), against 37 to 44% for sites exposed through aura. They also already got as much or more relatedcontentruby. Their decline is therefore not explained by a heavier dependence on the losing pipeline. We observe the correlation with the absence of aura, without an explanation to put against it.
6. Where the extra goes: national news brands
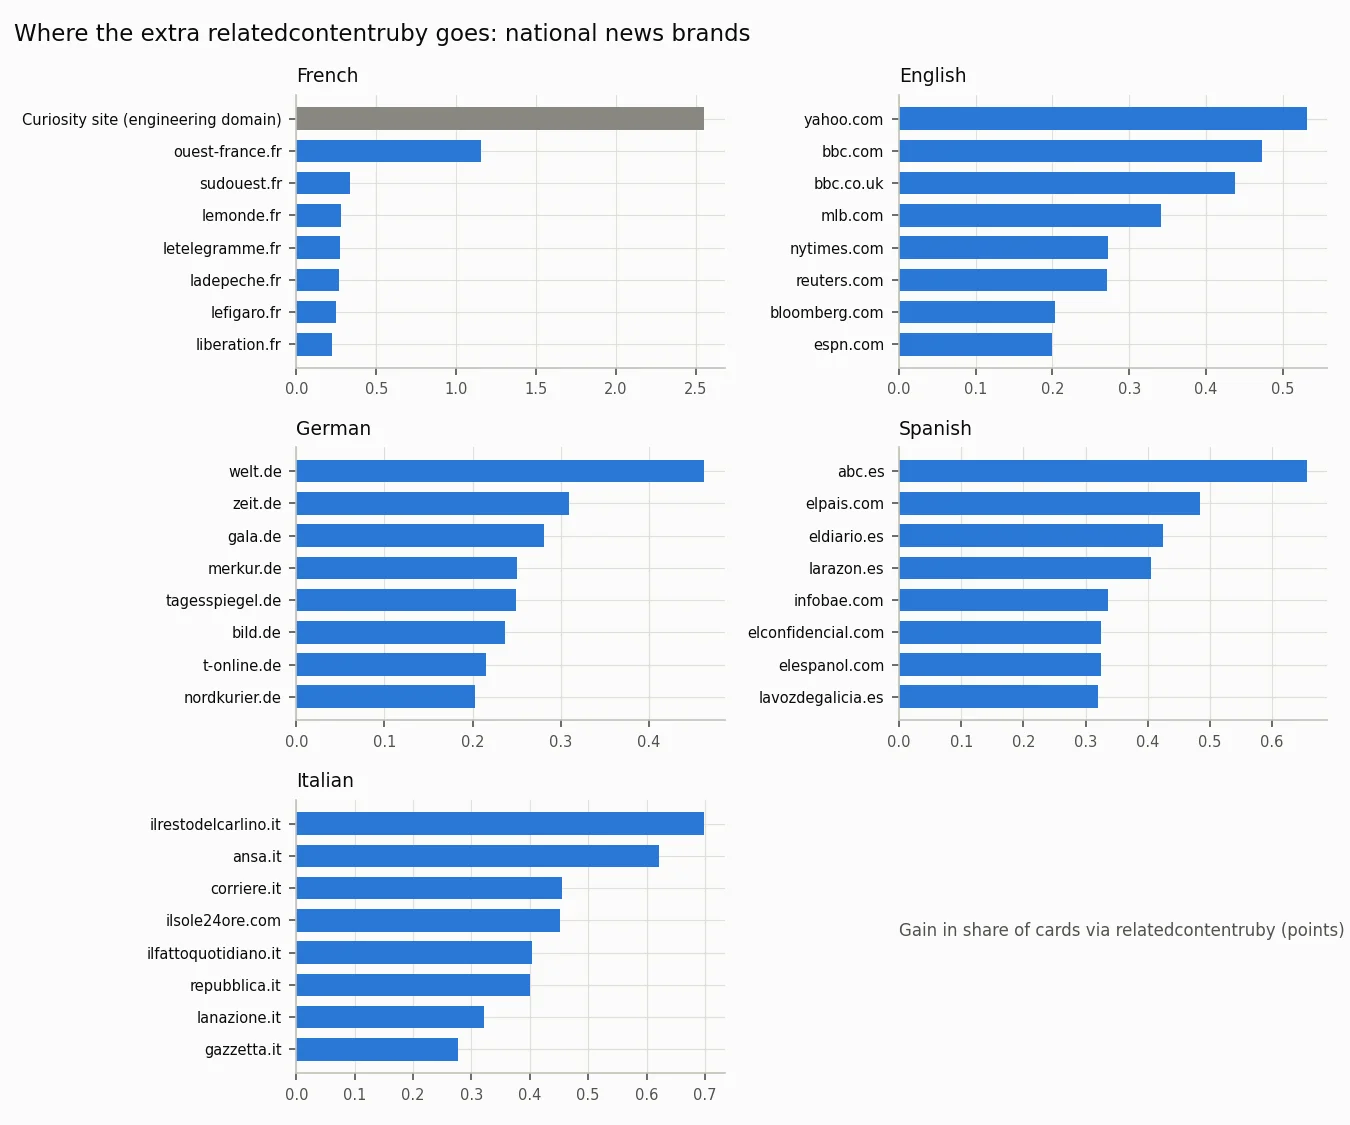 Figure 8: The winners: national news brands in all five languages, plus one French curiosity.
In every language, the points gained by relatedcontentruby go first to major news brands:
- French: ouest-france.fr, sudouest.fr, lemonde.fr, letelegramme.fr, ladepeche.fr, lefigaro.fr, liberation.fr.
- English: yahoo.com, bbc.com, bbc.co.uk, mlb.com, nytimes.com, reuters.com, bloomberg.com, espn.com.
- German: welt.de, zeit.de, gala.de, merkur.de, tagesspiegel.de, bild.de, t-online.de.
- Spanish: abc.es, elpais.com, eldiario.es, larazon.es, infobae.com, elconfidencial.com, elespanol.com.
- Italian: ilrestodelcarlino.it, ansa.it, corriere.it, ilsole24ore.com, ilfattoquotidiano.it, repubblica.it.
The top 20 beneficiaries take 56 to 69% of relatedcontentruby's gain depending on the language, and 81% in French.
One French exception deserves a mention: a site publishing curiosity content (history, nature, everyday economics), hosted on the expired domain of an engineering company, takes almost 30% of the French gain on its own. Its share of voice grows 17-fold in a week. A pipeline that recommends related articles can therefore also amplify a format finely tuned for chained reading, well beyond the big brands.
7. What did not change
- Topics: no abrupt shift. The differences are seasonal (politics gains 1.8 points in French with the back-to-school season).
- Video rises slightly (+1.5 points in French, +2.4 in English).
- The volume of captured cards stayed stable in all five languages (within 3% between the two periods): the panel saw what Discover served.
8. Takeaways for publishers
- If your Discover visibility dropped between September 15 and 17, you are not alone, and your site was not necessarily penalised. First step: the Discover tab of Search Console, day by day, to check that the break falls on these dates.
- Two dates, two causes. A drop limited to the 15th comes from the freeze, fixed since. A drop that starts on the 15th or 16th and holds all week matches the shift described here.
- The most exposed profile: a site with little presence in aura, outside the big national brands.
- The shift is one week old. relatedcontentruby has already eased by two to five points since its peak on the 17th, and the age of served articles is normalising. Don't conclude "dead" or "saved" before you have seen the next two weeks.
Each pipeline's share of your visibility, like your dependence on aura, can be measured through custom reports on 1492.vision.
Note: the 15th may well have been an incident at Google, with unwanted knock-on effects. Many SEOs noticed, for example, a complete absence of data in their GSC on the 16th. The gradual return of feed freshness to normal, and the shift towards "trusted" sites, could be a temporary measure while signals are recomputed.
Method and limits
The data comes from the Discover captures of the 1492 observatory, on article cards, for five publication languages (French, English, German, Spanish, Italian). The pipeline split compares August 31 to September 13 with September 17 to 21, to exclude the freeze of the 15th and the catch-up of the 16th. Site-level measures (exits, crushes, exposure through aura, winners) compare August 31 to September 13 with September 15 to 21, for sites with at least 20 captures a day, excluding video, ads and social platforms. The metric is share of voice, which is insensitive to changes in the panel. The control periods have exactly the same geometry (14 days before, 7 days after) around July 27 and August 17; the mid-August one is not perfectly calm (aura was already declining in most sites in French, German and Spanish), which makes the aura comparison more cautious; in French and English, the exit rate was also measured over 68 rolling windows since July. The weather is the v2 score published on 1492.vision.
Limits: the roles given to pipelines are interpretations drawn from our data. The post-break window covers a single week, and the pipeline split can still move either way. Some individual moves come from the calendar (end of sports seasons in English); the examples shown here are not among them. The German panel is smaller than the French and English ones, and the number of sites without aura in the top 200 is small (20 to 50 sites depending on the language). Finally, our data measures displays, not clicks or traffic: Search Console remains the reference for the impact on your visits.
Posted on 2026-09-22
More reliable, sourced reporting on Discover? Add us to your sources!
Add to sources Add to sources