Google Discover, September 15, 2026: ten hours without fresh articles
Between 07:15 and 17:30 UTC, Google Discover kept serving its usual volume of cards but stopped admitting new articles. In the English-language market the share of never-seen URLs fell by 41 % against the previous day, and the median age of the articles served rose from 6 hours to 23 hours. Admission pipelines lost most of their novelty; recirculation pipelines filled the gap. Every language we track was hit at the same minute, and a rebound started at 17:30.
On the morning of September 15 our freshness indicator stopped climbing. It did not exactly fall either: it flattened, and it stayed flat for ten hours. The volume of captured cards, meanwhile, held steady minute to minute. Discover served as much as usual, drawn from the previous day's stock.
1. Timeline
The indicator is the share of captured cards whose URL had never been seen by the panel before (new URLs / cards). Over eight days it cycles between about 5 % at night and 10 to 11 % in the daytime, with a very regular daily shape.
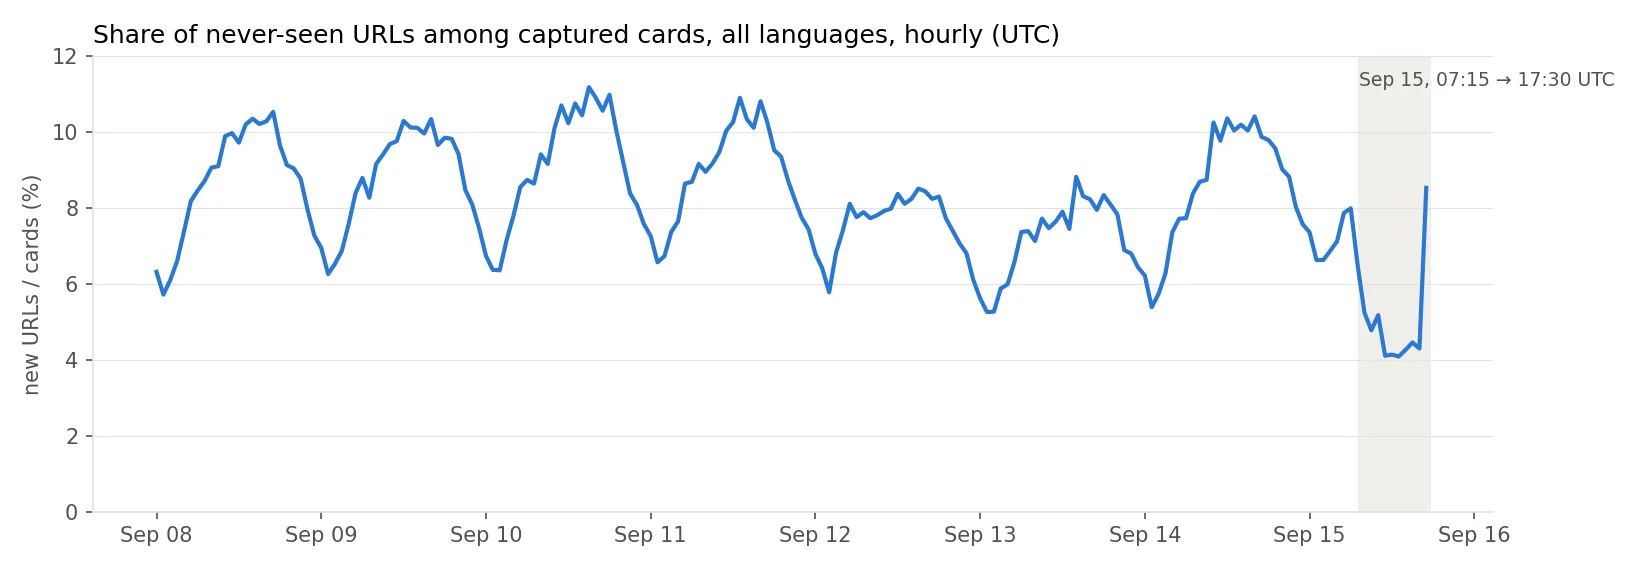
On September 15 the usual morning climb stops at 07:15 UTC. The indicator reaches its floor around 11:00, stays there until 17:15, then jumps back at 17:30.
| Window, UTC (Sep 15) | New URLs / cards, all languages |
|---|---|
| 06:00 to 07:00 | 7.0 to 8.7 % |
| 07:15 to 08:00 | 5.6 to 6.1 % |
| 08:15 to 10:45 | 4.5 to 5.6 % |
| 11:00 to 17:15 | 3.5 to 4.5 % |
| 17:30 to 17:45 | 10.7 then 15.7 % |
The same hours the day before ran between 8.4 and 10.4 %. The previous Tuesday (September 8) matched the day before, so this is not a weekday effect.
2. The English-language market
The EN market runs at a naturally higher novelty rate than most European ones (10 to 16 % in the daytime). On September 15 it fell to 7 to 8 % between 09:00 and 16:00 UTC, its lowest daytime level of the week.
| EN, window UTC | New URLs / cards |
|---|---|
| Sep 14, 08:00 to 17:00 | 13.3 % |
| Sep 8 (previous Tuesday), same window | 12.9 % |
| Sep 15, 08:00 to 17:00 | 8.3 % |
| Sep 15, after 17:30 | 18.6 % |
The share of EN cards carrying an article published less than 24 hours earlier is normally 75 to 85 % in the daytime. On September 15 it fell to 40 % by 16:00 UTC: readers were served yesterday's news all afternoon.
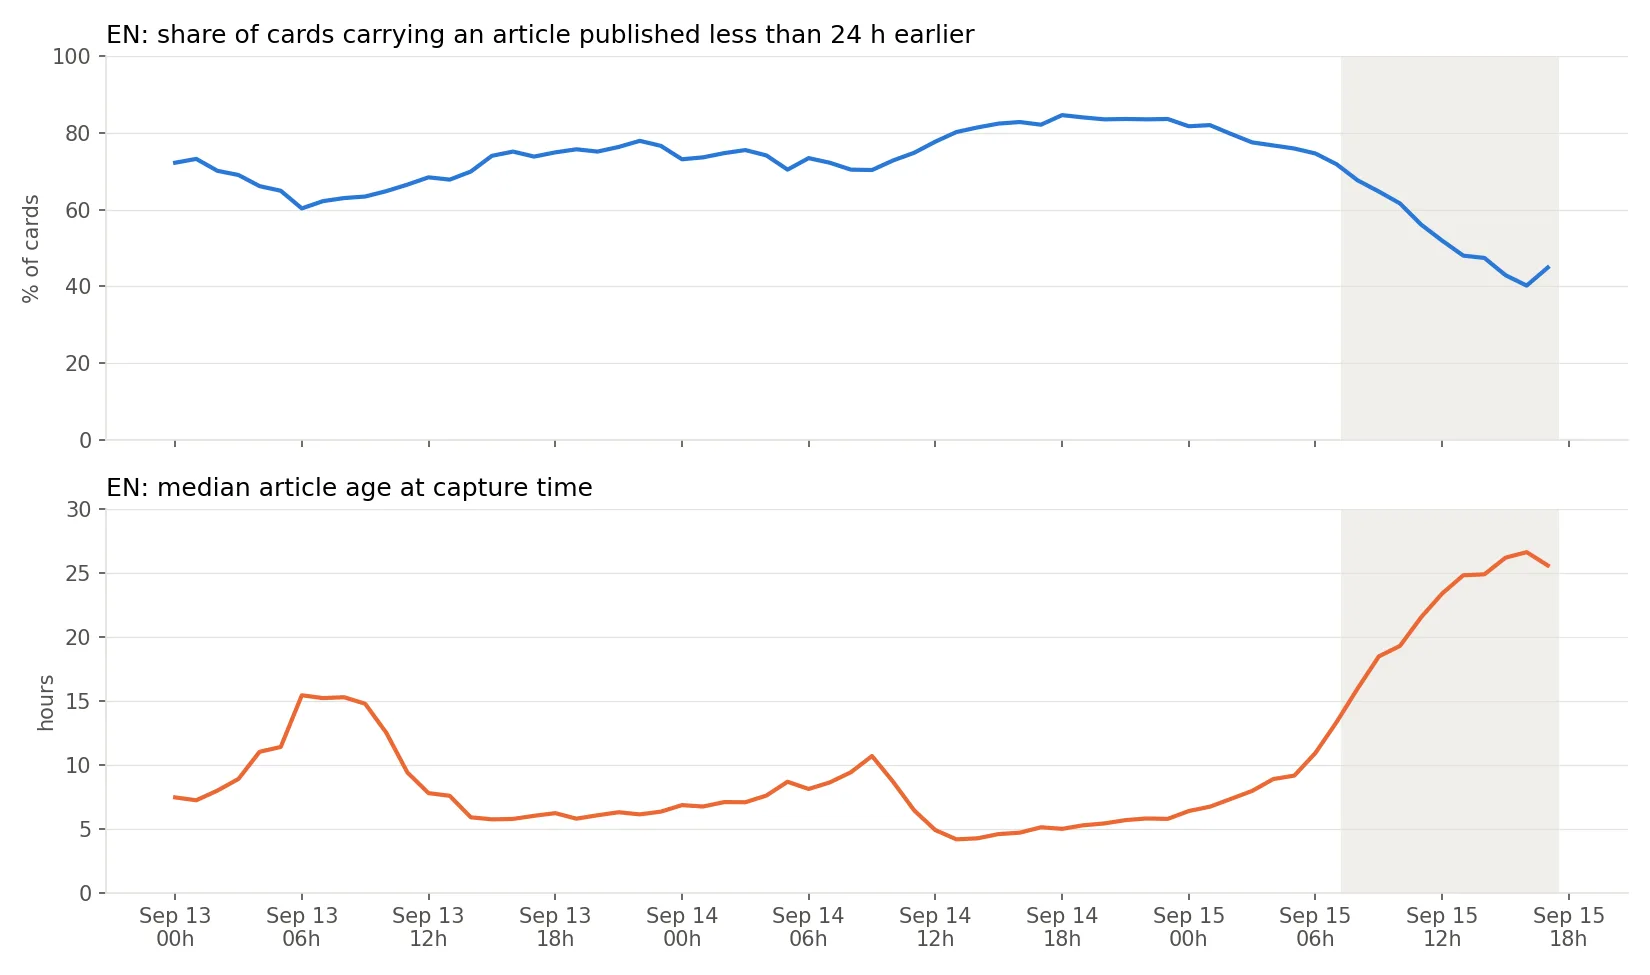
| EN, hour UTC | Cards on article < 24 h | Median age |
|---|---|---|
| Sep 14, 12:00 | 78 % | 5 h |
| Sep 15, 08:00 | 68 % | 16 h |
| Sep 15, 12:00 | 52 % | 23 h |
| Sep 15, 16:00 | 40 % | 27 h |
Median age rises steadily through the outage: every hour without admissions ages the served stock by one hour. The stock aged at the speed of the clock, which is the signature of a stopped admission flow.
Two capture controls point the same way. The number of new URLs recorded by the panel follows exactly the same curve as the novelty share, and publication dates, taken from the page itself and therefore independent of the panel, age in parallel.
3. Every language, same minute
The drop is simultaneous on all twelve languages we track, to the hour. Each panel has its own scale, since baseline novelty differs widely between markets (Japanese and Korean run at 20 to 30 %, French at 3 to 4 %).
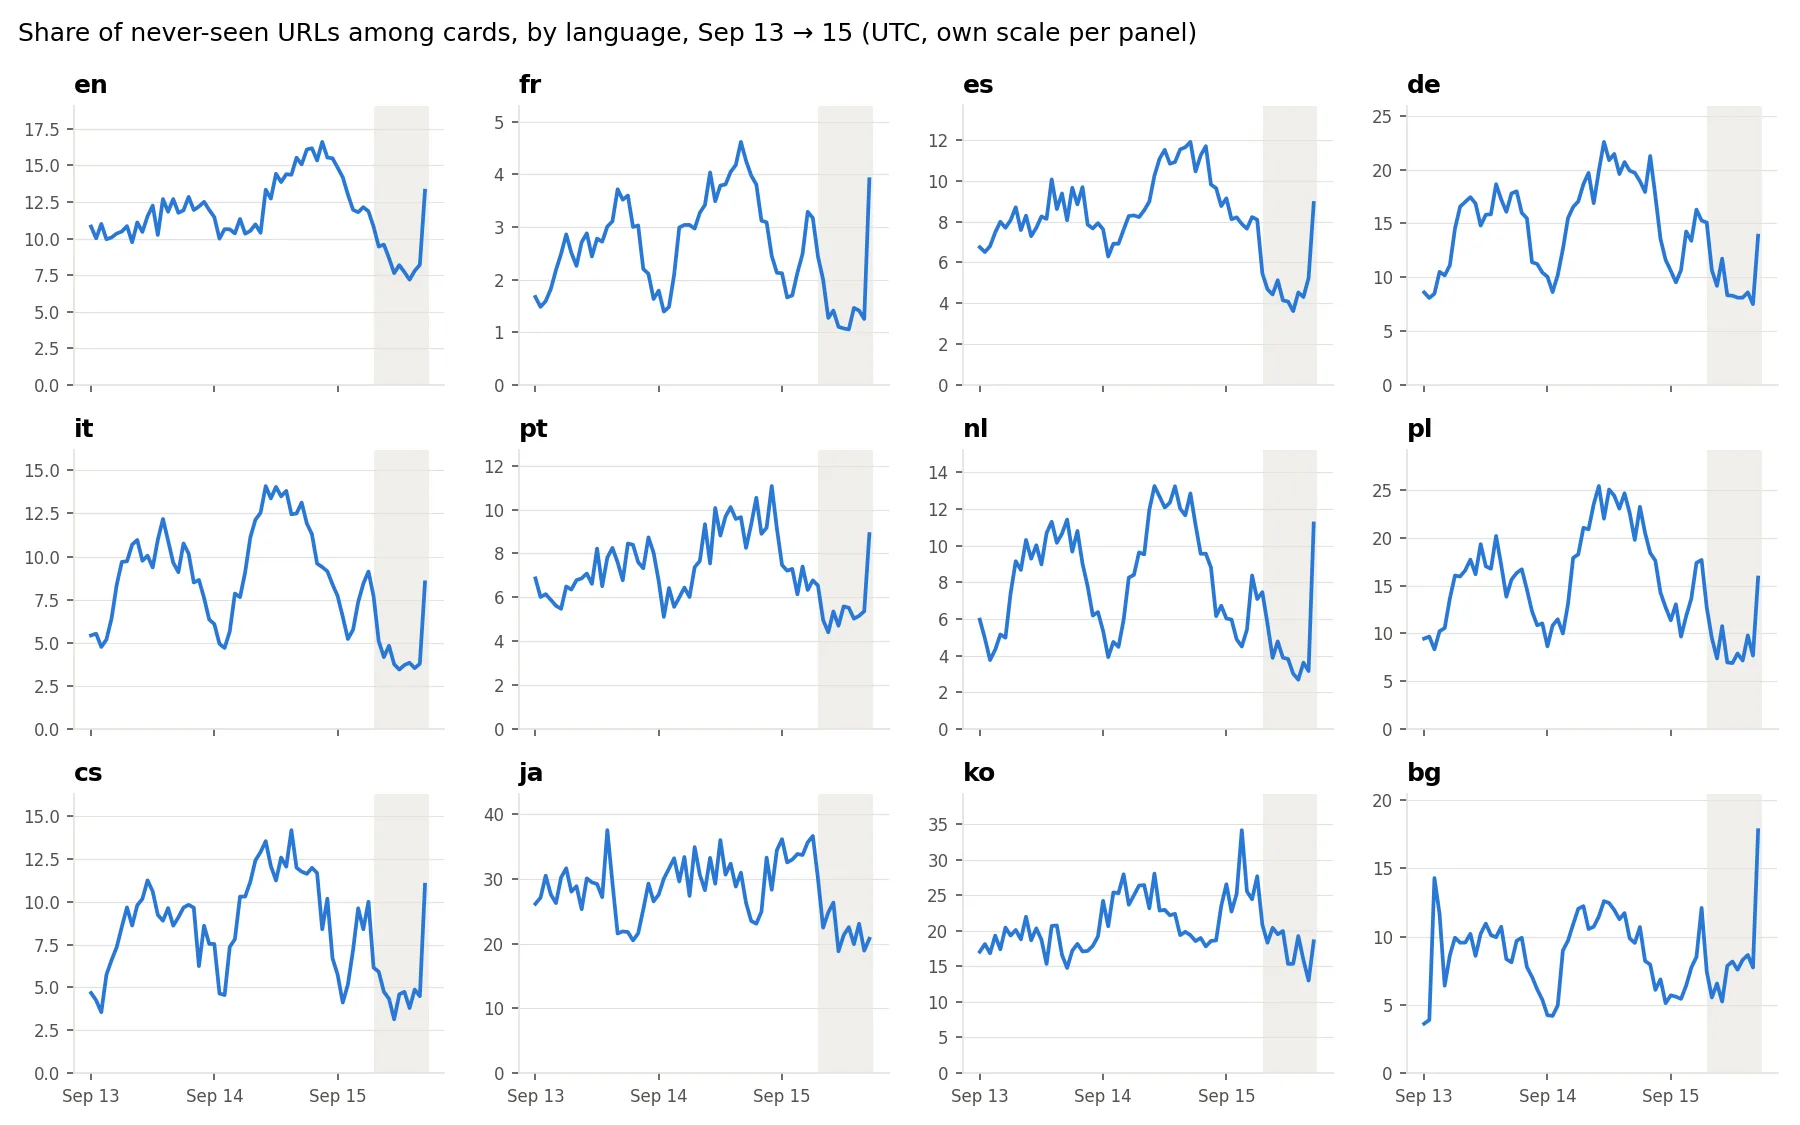
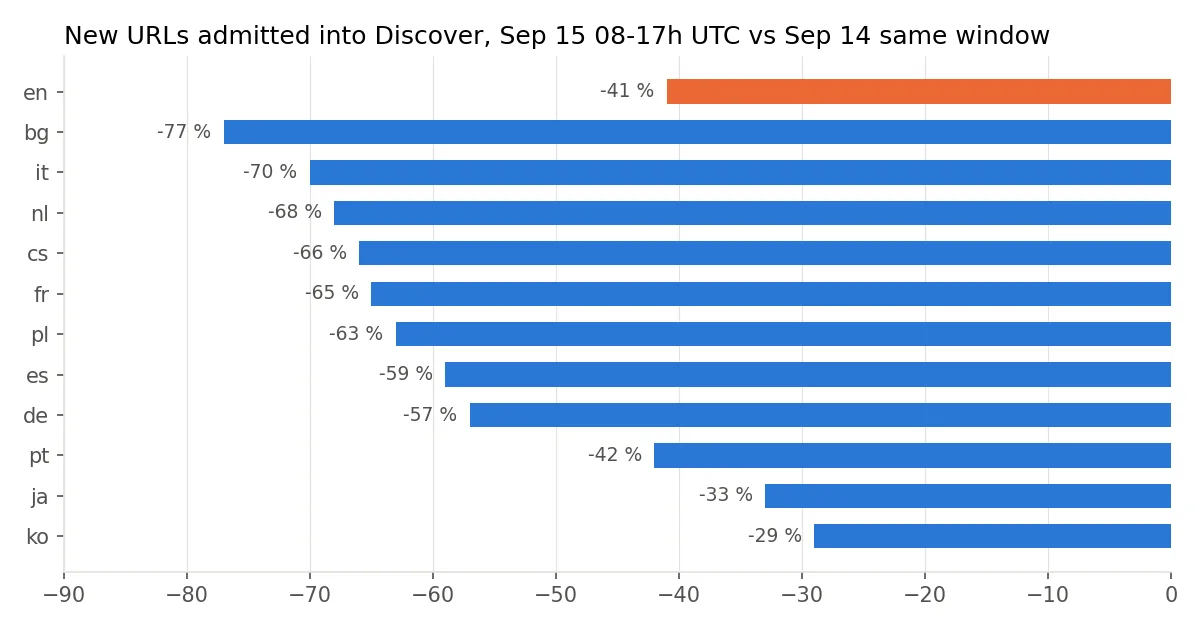
Size of the drop in new URLs admitted between 08:00 and 17:00 UTC, September 15 against September 14:
| Language | New URLs | Median age of served articles |
|---|---|---|
| en | -41 % | 6 h → 23 h |
| bg | -77 % | 4 h → 24 h |
| it | -70 % | 4 h → 26 h |
| nl | -68 % | 4 h → 28 h |
| cs | -66 % | 5 h → 33 h |
| fr | -65 % | 4 h → 22 h |
| pl | -63 % | 3 h → 26 h |
| es | -59 % | 4 h → 23 h |
| de | -57 % | 4 h → 23 h |
| pt | -42 % | 6 h → 27 h |
| ja | -33 % | 5 h → 25 h |
| ko | -29 % | 7 h → 24 h |
Two groups emerge. Continental European markets lost 57 to 77 % of their new entries. English, Portuguese and the Asian markets lost 29 to 42 %. The served articles, however, aged by the same amount everywhere, from 3 to 7 hours to 22 to 33 hours: the freshness outage was uniform, and what differed was each market's ability to keep a trickle of admissions going. The EN market, with its larger and more diverse publisher base, kept the widest trickle.
4. Reading by pipeline (EN market)
Each pipeline has its own novelty rate: the share of its cards carrying a never-seen URL. On September 15 that rate collapsed on every admission pipeline and stayed nearly intact on the recirculation pipelines.
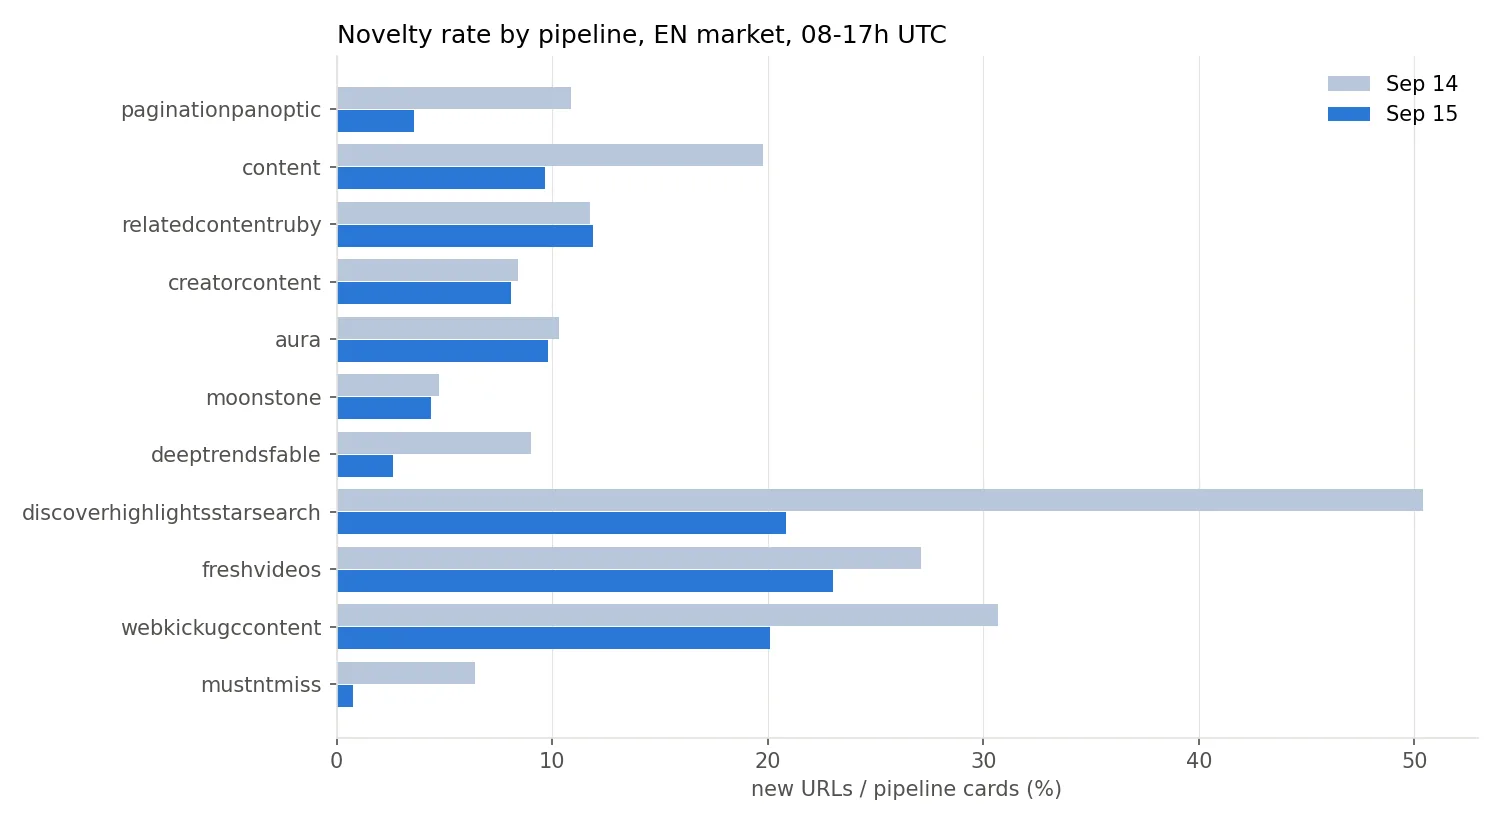
| Pipeline | Novelty Sep 14 | Novelty Sep 15 | Factor |
|---|---|---|---|
| mustntmiss | 6.4 % | 0.8 % | ÷ 8 |
| deeptrendsfable | 9.0 % | 2.6 % | ÷ 3.5 |
| paginationpanoptic | 10.9 % | 3.6 % | ÷ 3.0 |
| discoverhighlightsstarsearch | 50.4 % | 20.8 % | ÷ 2.4 |
| content | 19.8 % | 9.7 % | ÷ 2.0 |
| webkickugccontent | 30.7 % | 20.1 % | ÷ 1.5 |
| freshvideos | 27.1 % | 23.1 % | ÷ 1.2 |
| aura | 10.3 % | 9.8 % | ÷ 1.1 |
| creatorcontent | 8.4 % | 8.1 % | ÷ 1.0 |
| relatedcontentruby | 11.8 % | 11.9 % | ÷ 1.0 |
| moonstone | 4.8 % | 4.4 % | ÷ 1.1 |
EN market, 08:00 to 17:00 UTC, pipelines above 1 % of cards.
Second effect: visibility itself shifts. Pipelines that live on admissions lose cards; pipelines that live on stock gain them.
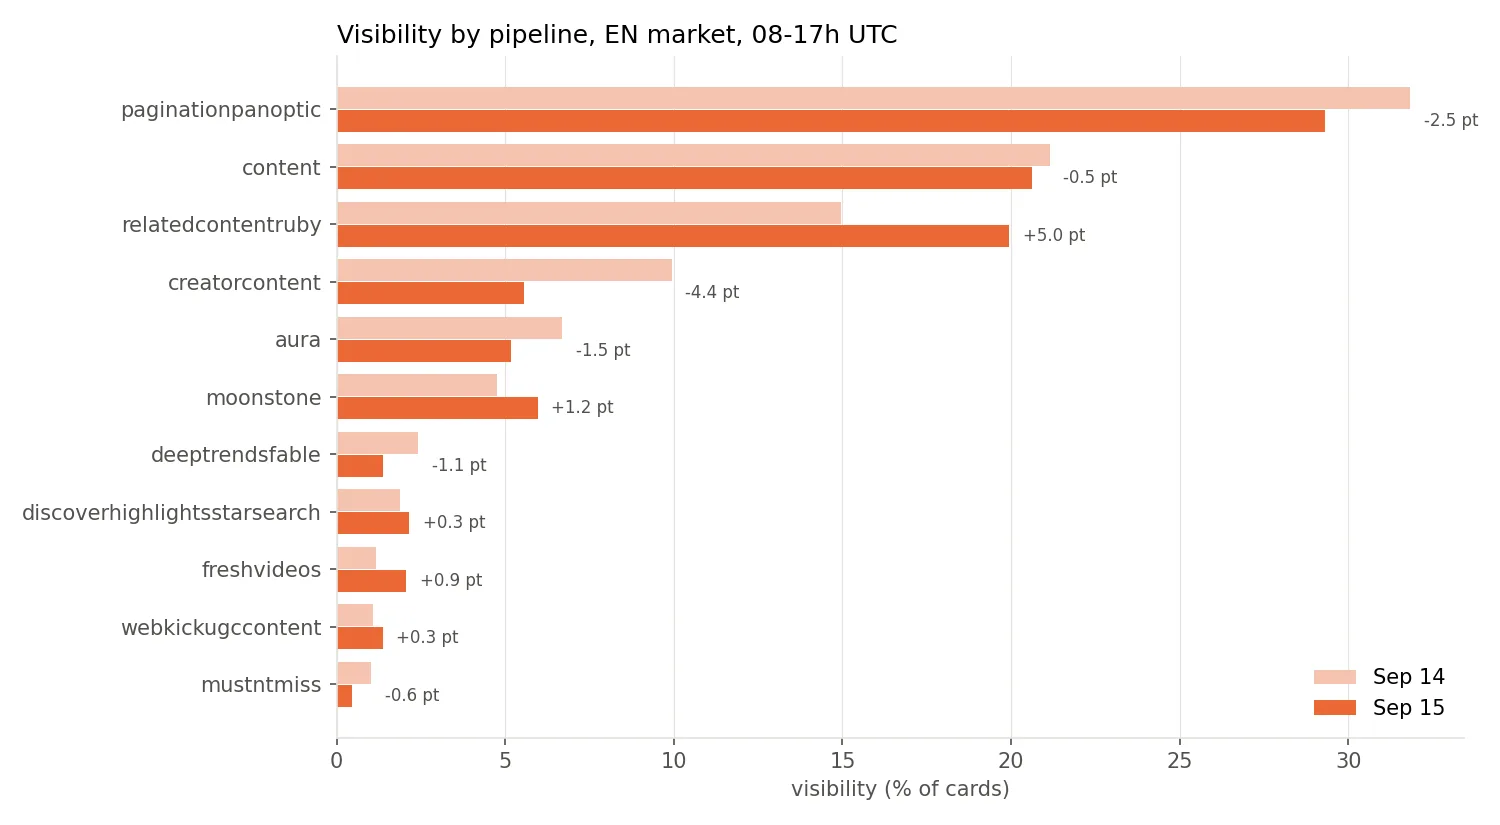
| Pipeline | Visibility Sep 14 | Visibility Sep 15 | Change |
|---|---|---|---|
| relatedcontentruby | 15.0 % | 19.9 % | +4.9 pt |
| moonstone | 4.8 % | 6.0 % | +1.2 pt |
| freshvideos | 1.2 % | 2.1 % | +0.9 pt |
| content | 21.1 % | 20.6 % | -0.5 pt |
| deeptrendsfable | 2.4 % | 1.4 % | -1.0 pt |
| aura | 6.7 % | 5.2 % | -1.5 pt |
| paginationpanoptic | 31.8 % | 29.3 % | -2.5 pt |
| creatorcontent | 9.9 % | 5.6 % | -4.3 pt |
content, paginationpanoptic, deeptrendsfable, mustntmiss are the pipelines that bring in the day's articles. Their novelty rate is divided by 2 to 8. deeptrendsfable, the trends pipeline most dependent on breaking news, is nearly switched off, and mustntmiss, the "don't miss" slot, admitted almost nothing new.
discoverhighlightsstarsearch, the ultra-fresh pipeline that normally carries one new URL in two, fell to one in five.
relatedcontentruby, moonstone, aura recycle articles already seen by the user or their profile. Their novelty rate is unchanged and they absorb the freed cards: relatedcontentruby gains almost 5 points and becomes the second pipeline of the day, on par with content.
creatorcontent keeps its novelty rate and loses 4.3 points of visibility: the creator surface went on admitting new URLs, it simply got fewer slots to do it in.
The marginal discovery pipelines (astria, deeptrends, itemitemcollaborativefiltering, geotargetingstories) saw their visibility multiplied by 2 to 8 in this window. They start from under 0.5 % and stay negligible, but they confirm that Discover went looking for anything to fill the feed.
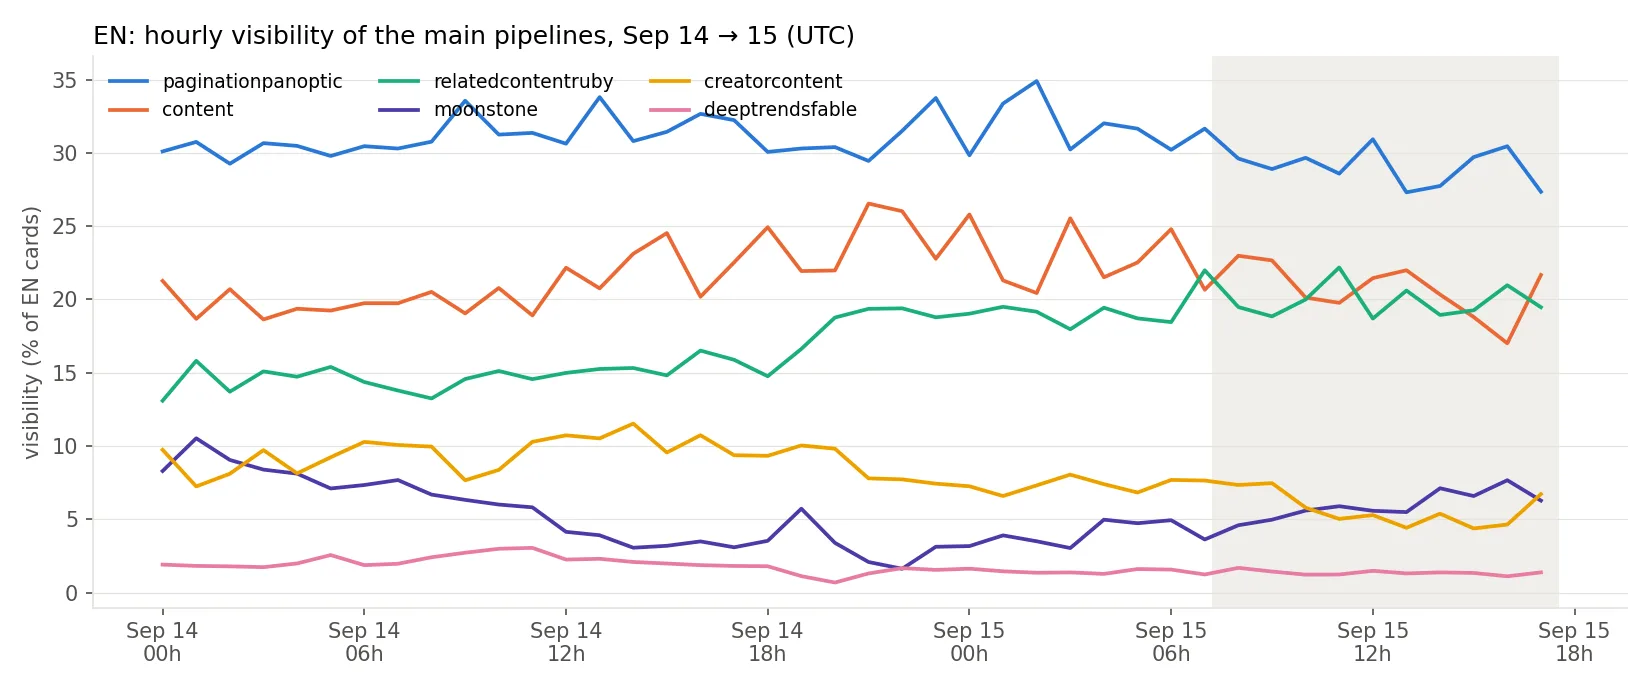
Hourly view: the crossover between content (orange) and relatedcontentruby (green) happens at the start of the shaded area. content had been running 5 to 8 points above relatedcontentruby all of September 14; the two trade places within the first hour of the outage.
5. Rebound
At 17:30 UTC the share of new URLs jumps to 10.7 % and then 15.7 % in the next quarter hour across all languages, above normal: a catch-up on the stock of articles published during the outage. In the EN market the post-17:30 rate is 18.6 %, against 13.3 % in the daytime the day before.
| Language | New URLs / cards, after 17:30 | Sep 14 daytime |
|---|---|---|
| en | 18.6 % | 13.3 % |
| es | 15.3 % | 10.6 % |
| de | 23.3 % | 20.2 % |
| fr | 6.8 % | 3.9 % |
| it | 14.0 % | 13.2 % |
| nl | 19.6 % | 12.1 % |
| pl | 26.3 % | 23.5 % |
| cs | 18.2 % | 12.6 % |
| bg | 23.5 % | 11.4 % |
In the last hour measured, the median age of served articles had not yet come back down.
This section was written on 25 minutes of data. It is superseded by the update of 16 September, which covers the evening and the night.
6. For a publisher
An article published between 07:00 and 17:30 UTC on September 15 had, in the EN market, roughly 40 % less chance of entering Discover than one published the day before at the same hour. In most continental European markets the odds were cut by two thirds.
A site's total visibility generally did not move: its articles from the day before took the place. If you see a Search Console dip on this day, look at your production profile first: the publishers taking the hit are the ones concentrated on same-day news, the ones that live on deeptrendsfable, mustntmiss and discoverhighlightsstarsearch.
The 17:30 rebound is a catch-up: articles published during the outage enter afterwards. Its exact size will be measurable on September 16, and that is the number we are most interested in here.
Method and limits
The data comes from the Discover captures of the independent 1492 panel, on article-type cards, all locales. Every value quoted is a share (percentage of captured cards) or an age, never a raw volume. The comparison window runs from 08:00 to 17:00 UTC on September 14 and 15, 2026; the pipeline tables are limited to pipelines above 1 % of cards, and section 4 covers the EN market only.
This report was written on September 15, 2026 at 18:30 UTC. The rebound section rests on 25 minutes of data and remains to be confirmed over the evening. September 16 will serve as the control measurement, both on the catch-up and on the return of median age to normal. Finally, these measurements describe what Discover served to our panel; they say nothing about the cause on Google's side. Index issues? freeze before a new spam update?
Update, 16 September 2026: the catch-up
This addendum updates the report with the evening and overnight data. It supersedes the "Rebound" section above, written on September 15 at 18:30 UTC on 25 minutes of data.
A three-hour catch-up, an overnight top-up, a normal morning
Admissions resumed at 17:30 UTC. The share of never-seen URLs among captured cards reached 17 % at 18:00, close to double a normal late afternoon, then stepped down until 21:00. The night then ran 3 points above the previous nights, and the morning of September 16 came back to its usual level.
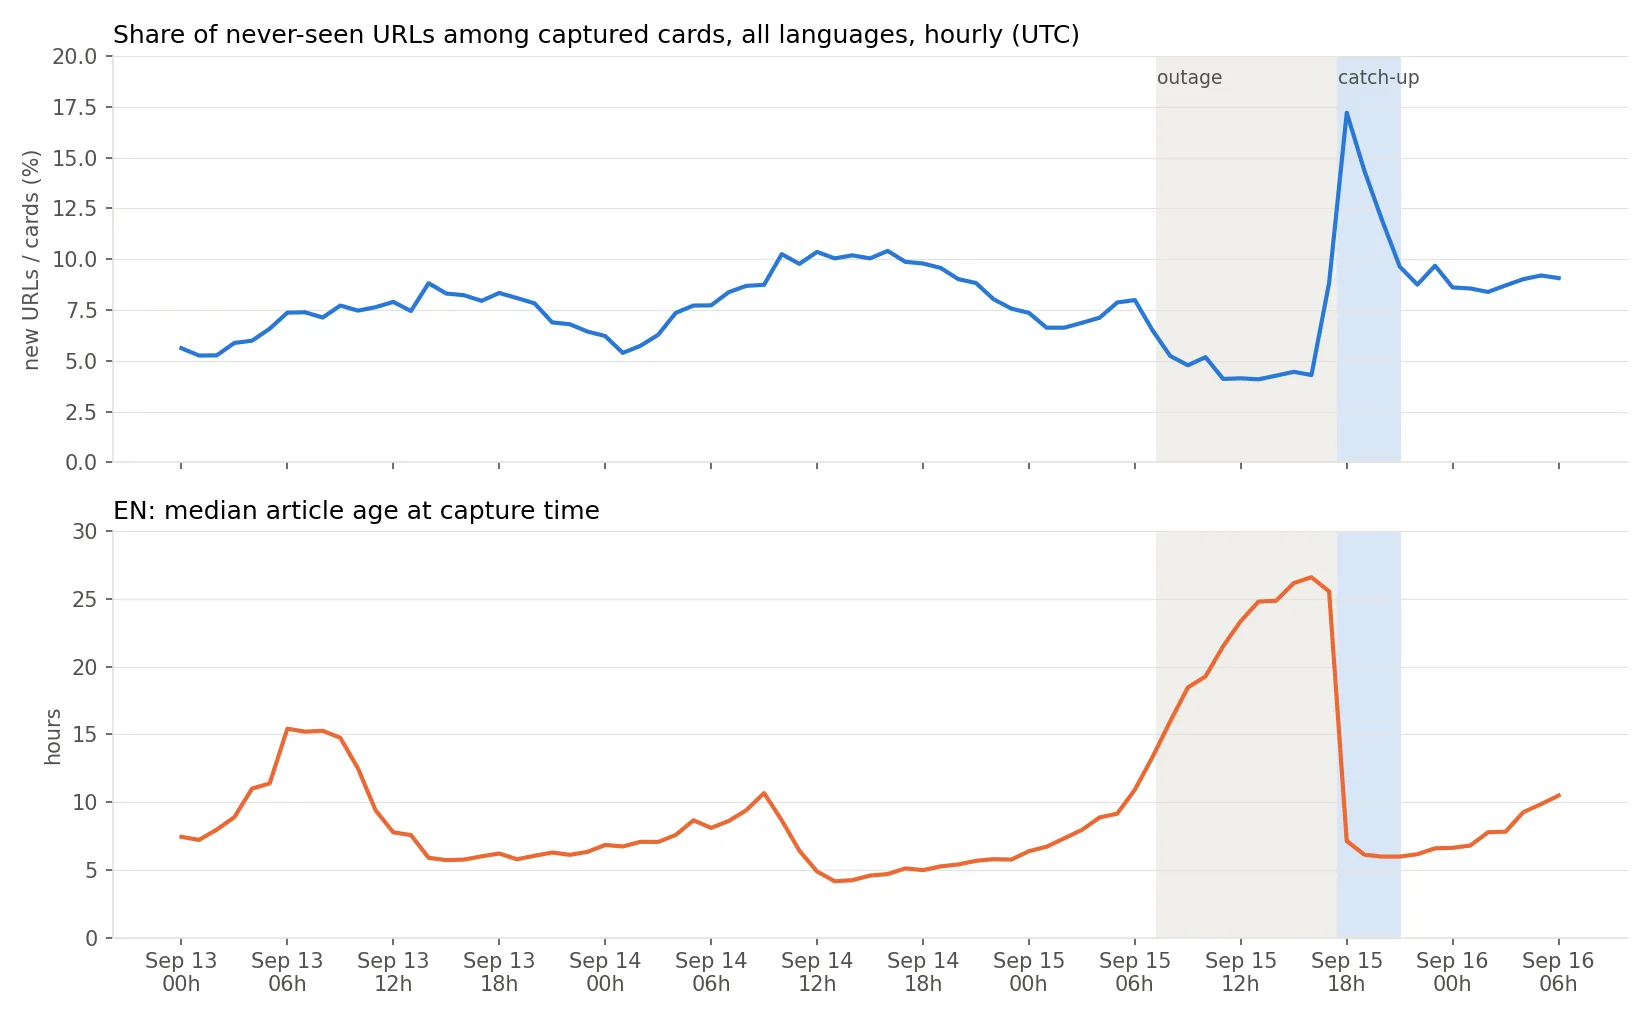
| Window, UTC | New URLs / cards | Normal reference |
|---|---|---|
| Sep 15, 11:00 to 17:15 | 3.5 to 4.5 % | 8 to 10 % |
| Sep 15, 18:00 | 17.2 % | ~9 % |
| Sep 15, 19:00 | 14.4 % | ~8 % |
| Sep 15, 20:00 | 11.9 % | ~8 % |
| Sep 15, 21:00 to 23:00 | 8.8 to 9.7 % | 6 to 7 % |
| Sep 16, 00:00 to 05:00 | 8.4 to 9.2 % | 5 to 6 % |
| Sep 16, 07:00 | 9.6 % | 8 to 8.4 % |
All languages, article-type cards. The reference is the same hour on September 13 and 14.
Served articles were fresh again within the first hour
In the English-language market, the median age of the article at capture time fell from 26 hours to 7 hours between 17:00 and 18:00, then to 6 hours from 19:00, the value of a normal evening. The usual overnight cycle resumed (age drifts up at night for lack of publishing, then drops in the morning).
| EN, hour UTC | Median age | Cards on article < 24 h |
|---|---|---|
| Sep 15, 16:00 | 27 h | 40 % |
| Sep 15, 18:00 | 7 h | 72 % |
| Sep 15, 19:00 | 6 h | 76 % |
| Sep 16, 03:00 | 8 h | 79 % |
| Sep 16, 06:00 | 10 h | 75 % |
The share of cards carrying an article under 24 hours old, down to 40 % at the worst of the outage, is back in its normal 75 to 85 % daytime range.
Every language caught up
Between 00:00 and 07:00 UTC on September 16, all twelve tracked languages sit above their novelty level of the same night two days earlier, by 1 to 5 points. That is the stock published during the outage still flowing in.
| Language | Night of Sep 16 | Night of Sep 14 |
|---|---|---|
| en | 13.9 % | 10.7 % |
| fr | 3.4 % | 2.3 % |
| es | 10.1 % | 7.4 % |
| de | 15.6 % | 12.9 % |
| it | 9.5 % | 6.6 % |
| pt | 7.9 % | 6.0 % |
| nl | 8.1 % | 5.8 % |
| pl | 17.1 % | 12.9 % |
| cs | 8.8 % | 7.5 % |
| ja | 34.8 % | 30.4 % |
| ko | 30.0 % | 24.6 % |
| bg | 7.5 % | 8.7 % |
Only Bulgarian sits slightly below, within the noise of its small size.
Bottom line
- Length of the admission outage: 10 h 15, from 07:15 to 17:30 UTC on September 15.
- Catch-up: three hours of over-admission (18:00 to 21:00), then a night 3 points above normal.
- Served-article age back to normal within one hour for the median, two hours for the under-24 h share.
- An article published during the outage entered 1 to 10 hours late, in the evening or overnight. It kept its admission and lost its freshness window: it competed with the evening's articles, in a lower-audience slot.
Addendum written 16 September 2026 at 07:30 UTC, data through 07:00 UTC. Same scope and method as the report above.
Posted on 2026-09-15
More reliable, sourced reporting on Discover? Add us to your sources!
Add to sources Add to sources